Afghan vs Immigrants from Morocco 10th Grade
COMPARE
Afghan
Immigrants from Morocco
10th Grade
10th Grade Comparison
Afghans
Immigrants from Morocco
93.1%
10TH GRADE
4.5/ 100
METRIC RATING
236th/ 347
METRIC RANK
93.5%
10TH GRADE
26.9/ 100
METRIC RATING
194th/ 347
METRIC RANK
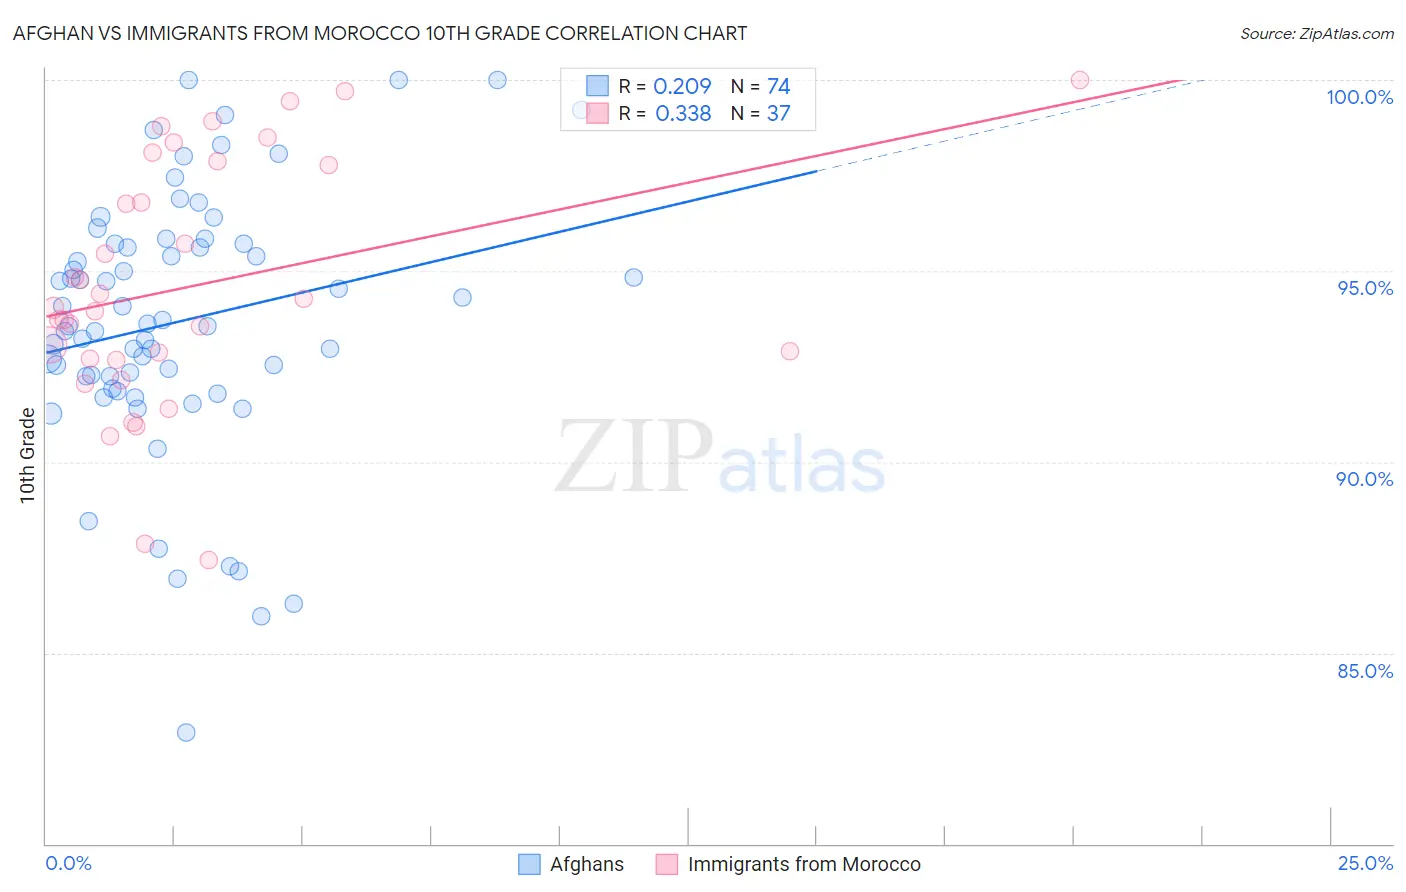
Afghan vs Immigrants from Morocco 10th Grade Correlation Chart
The statistical analysis conducted on geographies consisting of 148,851,685 people shows a weak positive correlation between the proportion of Afghans and percentage of population with at least 10th grade education in the United States with a correlation coefficient (R) of 0.209 and weighted average of 93.1%. Similarly, the statistical analysis conducted on geographies consisting of 178,912,438 people shows a mild positive correlation between the proportion of Immigrants from Morocco and percentage of population with at least 10th grade education in the United States with a correlation coefficient (R) of 0.338 and weighted average of 93.5%, a difference of 0.46%.
10th Grade Correlation Summary
| Measurement | Afghan | Immigrants from Morocco |
| Minimum | 82.9% | 87.4% |
| Maximum | 100.0% | 100.0% |
| Range | 17.1% | 12.6% |
| Mean | 93.7% | 94.6% |
| Median | 93.6% | 94.0% |
| Interquartile 25% (IQ1) | 92.2% | 92.7% |
| Interquartile 75% (IQ3) | 95.7% | 97.8% |
| Interquartile Range (IQR) | 3.5% | 5.1% |
| Standard Deviation (Sample) | 3.4% | 3.2% |
| Standard Deviation (Population) | 3.4% | 3.2% |
Similar Demographics by 10th Grade
Demographics Similar to Afghans by 10th Grade
In terms of 10th grade, the demographic groups most similar to Afghans are African (93.1%, a difference of 0.0%), Subsaharan African (93.1%, a difference of 0.010%), Immigrants from Panama (93.1%, a difference of 0.010%), Immigrants from Africa (93.1%, a difference of 0.020%), and South American Indian (93.1%, a difference of 0.020%).
| Demographics | Rating | Rank | 10th Grade |
| Immigrants | Ethiopia | 5.1 /100 | #229 | Tragic 93.1% |
| Immigrants | Africa | 5.0 /100 | #230 | Tragic 93.1% |
| South American Indians | 4.9 /100 | #231 | Tragic 93.1% |
| Bahamians | 4.9 /100 | #232 | Tragic 93.1% |
| Comanche | 4.9 /100 | #233 | Tragic 93.1% |
| Sub-Saharan Africans | 4.7 /100 | #234 | Tragic 93.1% |
| Africans | 4.6 /100 | #235 | Tragic 93.1% |
| Afghans | 4.5 /100 | #236 | Tragic 93.1% |
| Immigrants | Panama | 4.3 /100 | #237 | Tragic 93.1% |
| Nigerians | 4.2 /100 | #238 | Tragic 93.1% |
| Costa Ricans | 4.2 /100 | #239 | Tragic 93.1% |
| Immigrants | Hong Kong | 4.2 /100 | #240 | Tragic 93.1% |
| Immigrants | Somalia | 2.7 /100 | #241 | Tragic 93.0% |
| Immigrants | Cameroon | 2.6 /100 | #242 | Tragic 93.0% |
| Senegalese | 2.4 /100 | #243 | Tragic 93.0% |
Demographics Similar to Immigrants from Morocco by 10th Grade
In terms of 10th grade, the demographic groups most similar to Immigrants from Morocco are Cheyenne (93.5%, a difference of 0.0%), Immigrants from Malaysia (93.5%, a difference of 0.010%), Panamanian (93.5%, a difference of 0.010%), Moroccan (93.5%, a difference of 0.020%), and Pueblo (93.5%, a difference of 0.040%).
| Demographics | Rating | Rank | 10th Grade |
| Liberians | 34.7 /100 | #187 | Fair 93.6% |
| Marshallese | 33.2 /100 | #188 | Fair 93.6% |
| Immigrants | Pakistan | 32.5 /100 | #189 | Fair 93.6% |
| Laotians | 32.1 /100 | #190 | Fair 93.6% |
| Yup'ik | 31.1 /100 | #191 | Fair 93.6% |
| Immigrants | Malaysia | 28.0 /100 | #192 | Fair 93.5% |
| Panamanians | 28.0 /100 | #193 | Fair 93.5% |
| Immigrants | Morocco | 26.9 /100 | #194 | Fair 93.5% |
| Cheyenne | 26.8 /100 | #195 | Fair 93.5% |
| Moroccans | 25.3 /100 | #196 | Fair 93.5% |
| Pueblo | 23.9 /100 | #197 | Fair 93.5% |
| Immigrants | Micronesia | 23.2 /100 | #198 | Fair 93.5% |
| Asians | 23.0 /100 | #199 | Fair 93.5% |
| Hopi | 22.2 /100 | #200 | Fair 93.5% |
| Hawaiians | 21.8 /100 | #201 | Fair 93.5% |