Liberian vs Immigrants from Sri Lanka Doctorate Degree
COMPARE
Liberian
Immigrants from Sri Lanka
Doctorate Degree
Doctorate Degree Comparison
Liberians
Immigrants from Sri Lanka
1.5%
DOCTORATE DEGREE
0.9/ 100
METRIC RATING
259th/ 347
METRIC RANK
2.8%
DOCTORATE DEGREE
100.0/ 100
METRIC RATING
18th/ 347
METRIC RANK
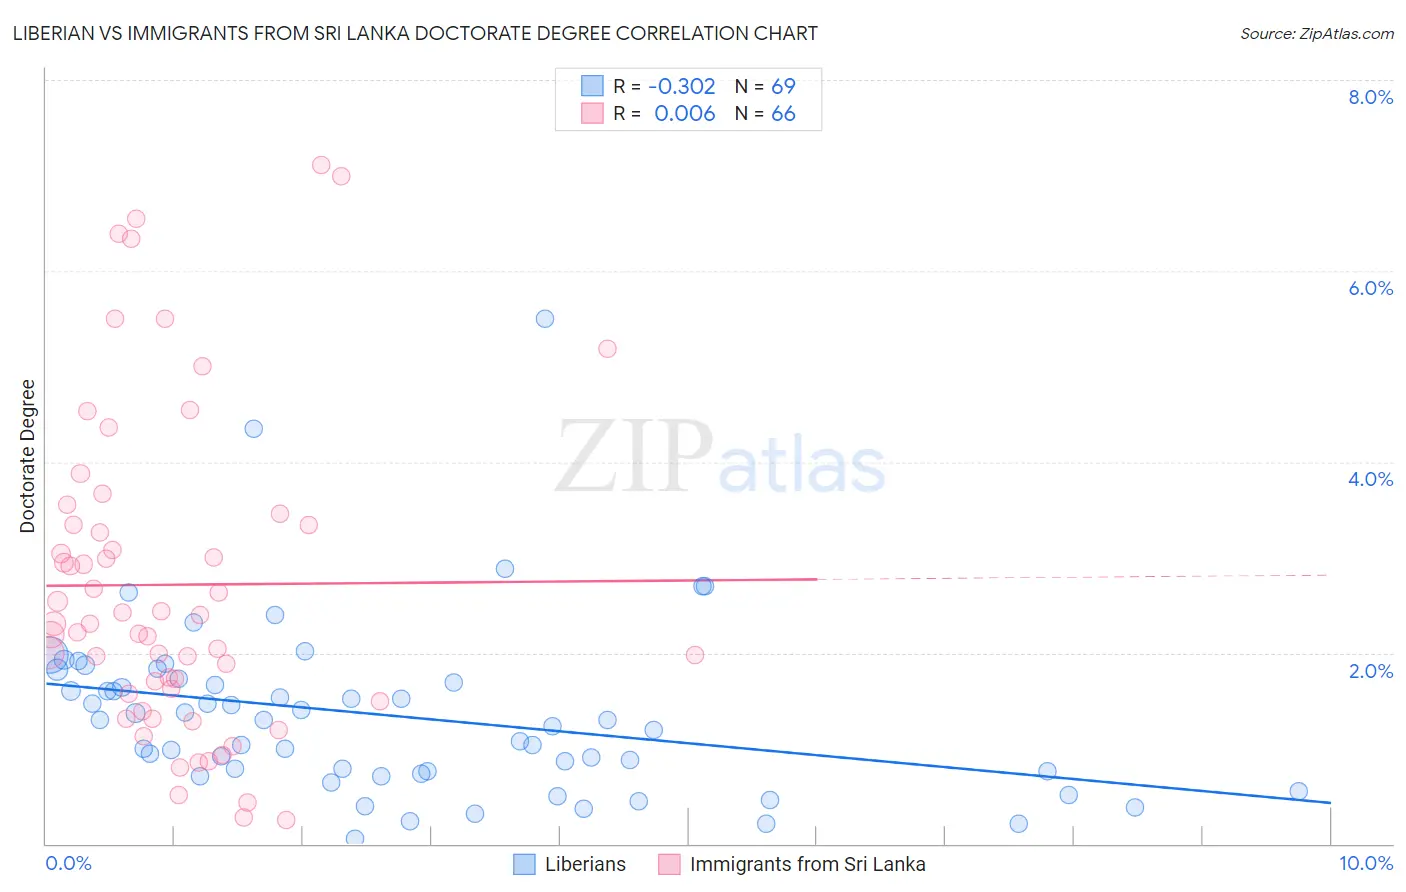
Liberian vs Immigrants from Sri Lanka Doctorate Degree Correlation Chart
The statistical analysis conducted on geographies consisting of 117,723,889 people shows a mild negative correlation between the proportion of Liberians and percentage of population with at least doctorate degree education in the United States with a correlation coefficient (R) of -0.302 and weighted average of 1.5%. Similarly, the statistical analysis conducted on geographies consisting of 149,516,324 people shows no correlation between the proportion of Immigrants from Sri Lanka and percentage of population with at least doctorate degree education in the United States with a correlation coefficient (R) of 0.006 and weighted average of 2.8%, a difference of 83.8%.
Doctorate Degree Correlation Summary
| Measurement | Liberian | Immigrants from Sri Lanka |
| Minimum | 0.049% | 0.25% |
| Maximum | 5.5% | 7.1% |
| Range | 5.4% | 6.9% |
| Mean | 1.3% | 2.7% |
| Median | 1.3% | 2.3% |
| Interquartile 25% (IQ1) | 0.74% | 1.6% |
| Interquartile 75% (IQ3) | 1.7% | 3.3% |
| Interquartile Range (IQR) | 0.96% | 1.8% |
| Standard Deviation (Sample) | 0.92% | 1.7% |
| Standard Deviation (Population) | 0.91% | 1.7% |
Similar Demographics by Doctorate Degree
Demographics Similar to Liberians by Doctorate Degree
In terms of doctorate degree, the demographic groups most similar to Liberians are Immigrants from West Indies (1.5%, a difference of 0.030%), Japanese (1.5%, a difference of 0.10%), Chippewa (1.5%, a difference of 0.28%), Central American Indian (1.5%, a difference of 0.51%), and Trinidadian and Tobagonian (1.5%, a difference of 0.55%).
| Demographics | Rating | Rank | Doctorate Degree |
| Yuman | 1.1 /100 | #252 | Tragic 1.5% |
| Americans | 1.0 /100 | #253 | Tragic 1.5% |
| Immigrants | Cambodia | 1.0 /100 | #254 | Tragic 1.5% |
| Trinidadians and Tobagonians | 1.0 /100 | #255 | Tragic 1.5% |
| Central American Indians | 1.0 /100 | #256 | Tragic 1.5% |
| Chippewa | 0.9 /100 | #257 | Tragic 1.5% |
| Immigrants | West Indies | 0.9 /100 | #258 | Tragic 1.5% |
| Liberians | 0.9 /100 | #259 | Tragic 1.5% |
| Japanese | 0.9 /100 | #260 | Tragic 1.5% |
| Immigrants | Portugal | 0.8 /100 | #261 | Tragic 1.5% |
| Chickasaw | 0.7 /100 | #262 | Tragic 1.5% |
| Immigrants | Bahamas | 0.7 /100 | #263 | Tragic 1.5% |
| Blackfeet | 0.7 /100 | #264 | Tragic 1.5% |
| Nicaraguans | 0.6 /100 | #265 | Tragic 1.5% |
| Immigrants | Liberia | 0.5 /100 | #266 | Tragic 1.5% |
Demographics Similar to Immigrants from Sri Lanka by Doctorate Degree
In terms of doctorate degree, the demographic groups most similar to Immigrants from Sri Lanka are Immigrants from Australia (2.8%, a difference of 0.24%), Immigrants from Japan (2.8%, a difference of 0.37%), Immigrants from Hong Kong (2.8%, a difference of 0.73%), Eastern European (2.8%, a difference of 0.94%), and Thai (2.8%, a difference of 1.1%).
| Demographics | Rating | Rank | Doctorate Degree |
| Indians (Asian) | 100.0 /100 | #11 | Exceptional 2.9% |
| Immigrants | Belgium | 100.0 /100 | #12 | Exceptional 2.9% |
| Immigrants | Sweden | 100.0 /100 | #13 | Exceptional 2.9% |
| Immigrants | France | 100.0 /100 | #14 | Exceptional 2.9% |
| Immigrants | India | 100.0 /100 | #15 | Exceptional 2.8% |
| Eastern Europeans | 100.0 /100 | #16 | Exceptional 2.8% |
| Immigrants | Australia | 100.0 /100 | #17 | Exceptional 2.8% |
| Immigrants | Sri Lanka | 100.0 /100 | #18 | Exceptional 2.8% |
| Immigrants | Japan | 100.0 /100 | #19 | Exceptional 2.8% |
| Immigrants | Hong Kong | 100.0 /100 | #20 | Exceptional 2.8% |
| Thais | 100.0 /100 | #21 | Exceptional 2.8% |
| Mongolians | 100.0 /100 | #22 | Exceptional 2.8% |
| Immigrants | Denmark | 100.0 /100 | #23 | Exceptional 2.8% |
| Israelis | 100.0 /100 | #24 | Exceptional 2.7% |
| Immigrants | Saudi Arabia | 100.0 /100 | #25 | Exceptional 2.7% |