Colombian vs Immigrants from Spain Doctorate Degree
COMPARE
Colombian
Immigrants from Spain
Doctorate Degree
Doctorate Degree Comparison
Colombians
Immigrants from Spain
1.7%
DOCTORATE DEGREE
16.1/ 100
METRIC RATING
208th/ 347
METRIC RANK
2.6%
DOCTORATE DEGREE
100.0/ 100
METRIC RATING
36th/ 347
METRIC RANK
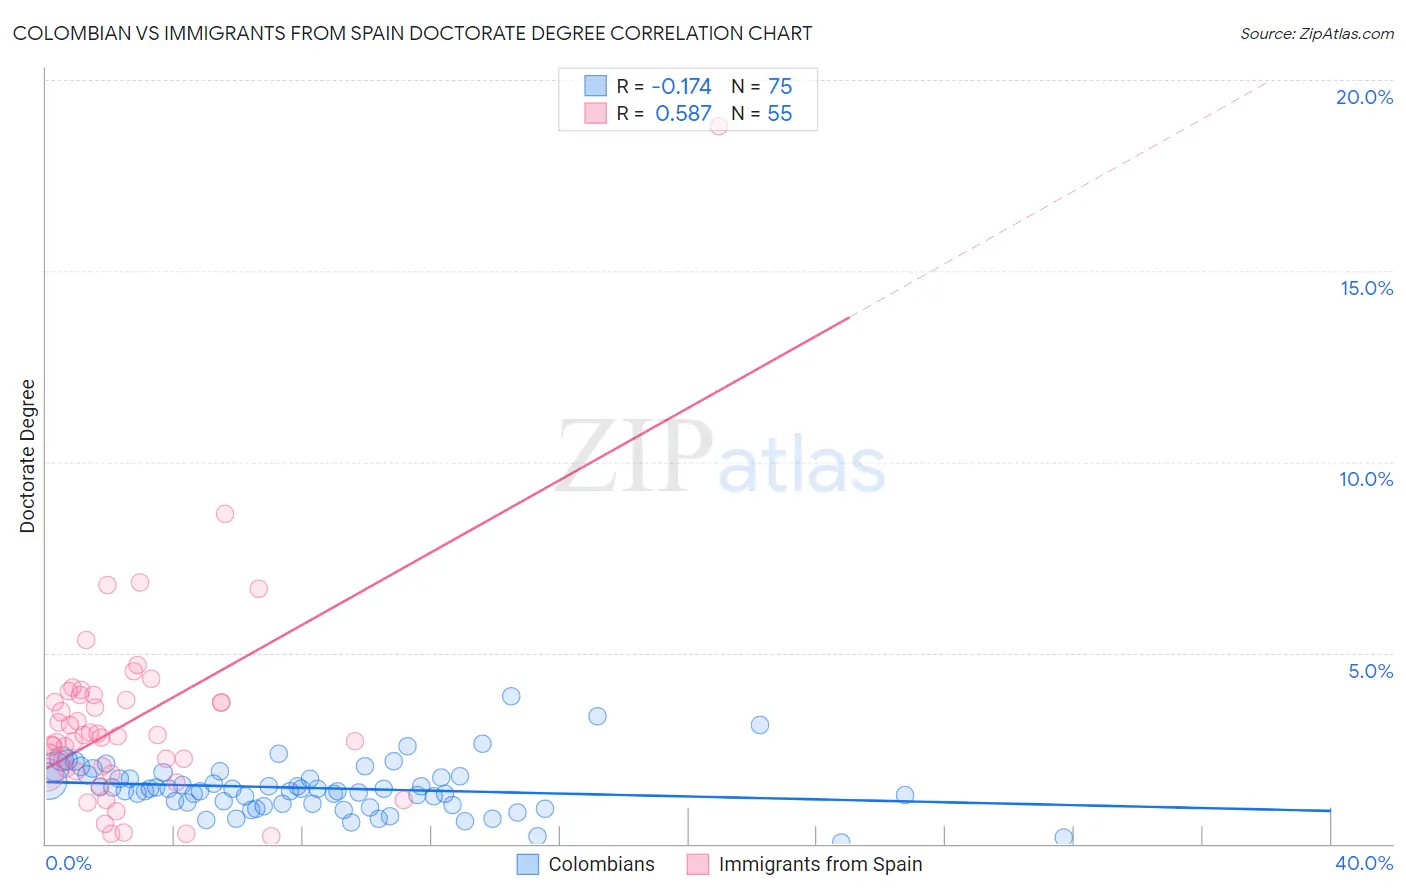
Colombian vs Immigrants from Spain Doctorate Degree Correlation Chart
The statistical analysis conducted on geographies consisting of 415,824,999 people shows a poor negative correlation between the proportion of Colombians and percentage of population with at least doctorate degree education in the United States with a correlation coefficient (R) of -0.174 and weighted average of 1.7%. Similarly, the statistical analysis conducted on geographies consisting of 238,840,570 people shows a substantial positive correlation between the proportion of Immigrants from Spain and percentage of population with at least doctorate degree education in the United States with a correlation coefficient (R) of 0.587 and weighted average of 2.6%, a difference of 48.3%.
Doctorate Degree Correlation Summary
| Measurement | Colombian | Immigrants from Spain |
| Minimum | 0.049% | 0.19% |
| Maximum | 3.9% | 18.8% |
| Range | 3.8% | 18.6% |
| Mean | 1.5% | 3.2% |
| Median | 1.4% | 2.8% |
| Interquartile 25% (IQ1) | 1.0% | 1.9% |
| Interquartile 75% (IQ3) | 1.8% | 3.9% |
| Interquartile Range (IQR) | 0.72% | 2.0% |
| Standard Deviation (Sample) | 0.67% | 2.7% |
| Standard Deviation (Population) | 0.67% | 2.7% |
Similar Demographics by Doctorate Degree
Demographics Similar to Colombians by Doctorate Degree
In terms of doctorate degree, the demographic groups most similar to Colombians are Immigrants from Western Africa (1.7%, a difference of 0.19%), Tongan (1.7%, a difference of 0.27%), Yugoslavian (1.7%, a difference of 0.28%), Immigrants from Armenia (1.7%, a difference of 0.29%), and Immigrants from South Eastern Asia (1.7%, a difference of 0.41%).
| Demographics | Rating | Rank | Doctorate Degree |
| Immigrants | Nigeria | 22.4 /100 | #201 | Fair 1.8% |
| Portuguese | 21.4 /100 | #202 | Fair 1.8% |
| Immigrants | Vietnam | 21.4 /100 | #203 | Fair 1.8% |
| Somalis | 21.2 /100 | #204 | Fair 1.7% |
| Venezuelans | 19.5 /100 | #205 | Poor 1.7% |
| Immigrants | Peru | 17.6 /100 | #206 | Poor 1.7% |
| Yugoslavians | 17.1 /100 | #207 | Poor 1.7% |
| Colombians | 16.1 /100 | #208 | Poor 1.7% |
| Immigrants | Western Africa | 15.4 /100 | #209 | Poor 1.7% |
| Tongans | 15.1 /100 | #210 | Poor 1.7% |
| Immigrants | Armenia | 15.1 /100 | #211 | Poor 1.7% |
| Immigrants | South Eastern Asia | 14.7 /100 | #212 | Poor 1.7% |
| Koreans | 14.2 /100 | #213 | Poor 1.7% |
| Pueblo | 14.2 /100 | #214 | Poor 1.7% |
| Alaskan Athabascans | 13.8 /100 | #215 | Poor 1.7% |
Demographics Similar to Immigrants from Spain by Doctorate Degree
In terms of doctorate degree, the demographic groups most similar to Immigrants from Spain are Immigrants from Malaysia (2.6%, a difference of 0.060%), Cypriot (2.6%, a difference of 0.12%), Cambodian (2.6%, a difference of 0.23%), Immigrants from Kuwait (2.6%, a difference of 0.26%), and Immigrants from Northern Europe (2.6%, a difference of 0.41%).
| Demographics | Rating | Rank | Doctorate Degree |
| Immigrants | South Central Asia | 100.0 /100 | #29 | Exceptional 2.6% |
| Immigrants | Korea | 100.0 /100 | #30 | Exceptional 2.6% |
| Latvians | 100.0 /100 | #31 | Exceptional 2.6% |
| Immigrants | Northern Europe | 100.0 /100 | #32 | Exceptional 2.6% |
| Cambodians | 100.0 /100 | #33 | Exceptional 2.6% |
| Cypriots | 100.0 /100 | #34 | Exceptional 2.6% |
| Immigrants | Malaysia | 100.0 /100 | #35 | Exceptional 2.6% |
| Immigrants | Spain | 100.0 /100 | #36 | Exceptional 2.6% |
| Immigrants | Kuwait | 100.0 /100 | #37 | Exceptional 2.6% |
| Russians | 100.0 /100 | #38 | Exceptional 2.6% |
| Immigrants | Ireland | 100.0 /100 | #39 | Exceptional 2.5% |
| Estonians | 100.0 /100 | #40 | Exceptional 2.5% |
| Immigrants | Russia | 100.0 /100 | #41 | Exceptional 2.5% |
| New Zealanders | 100.0 /100 | #42 | Exceptional 2.5% |
| Soviet Union | 100.0 /100 | #43 | Exceptional 2.5% |