Navajo vs Immigrants from Ecuador Professional Degree
COMPARE
Navajo
Immigrants from Ecuador
Professional Degree
Professional Degree Comparison
Navajo
Immigrants from Ecuador
2.9%
PROFESSIONAL DEGREE
0.0/ 100
METRIC RATING
338th/ 347
METRIC RANK
3.8%
PROFESSIONAL DEGREE
2.3/ 100
METRIC RATING
240th/ 347
METRIC RANK
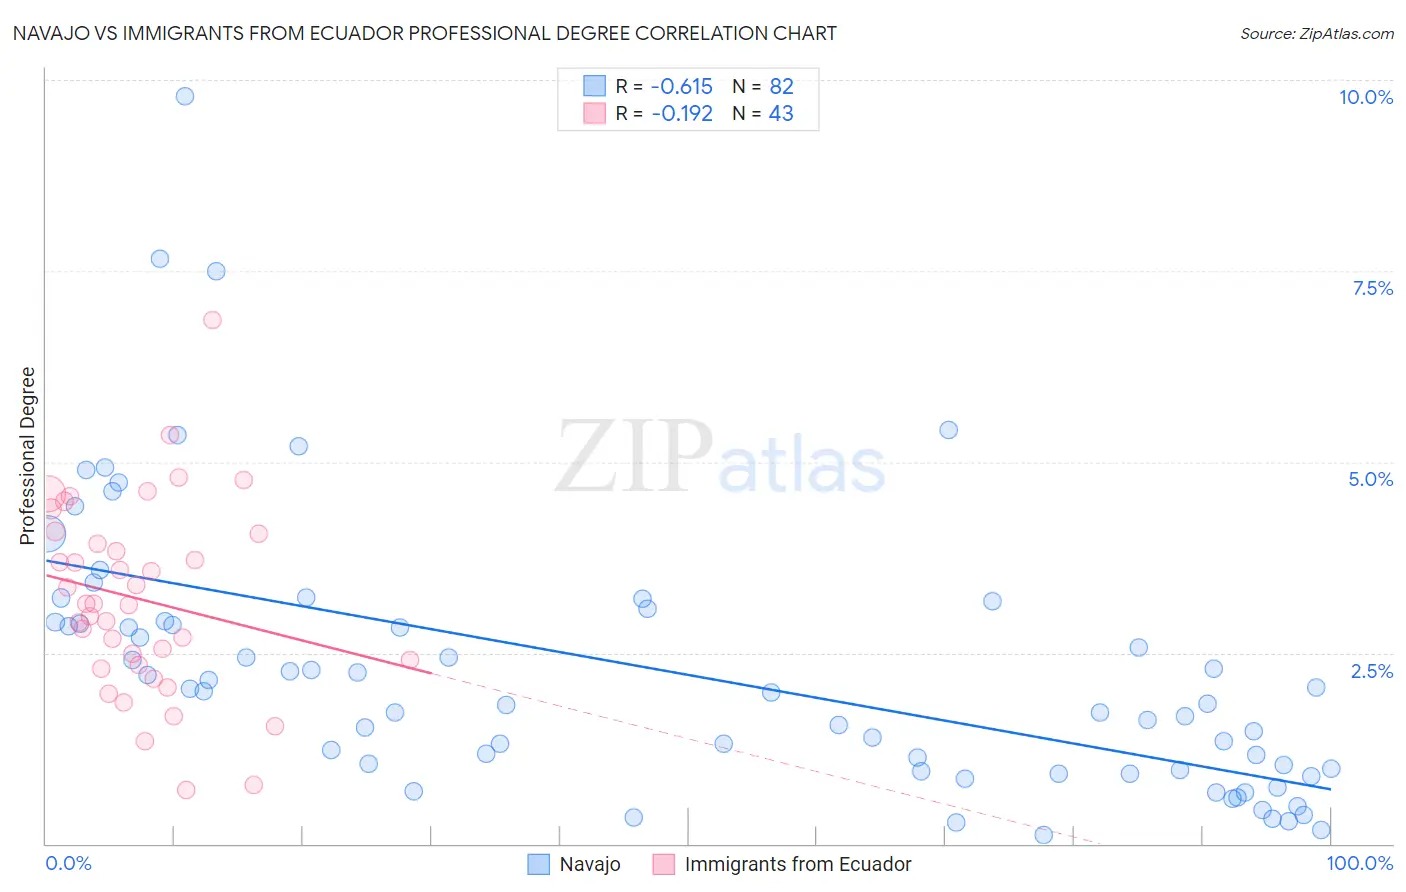
Navajo vs Immigrants from Ecuador Professional Degree Correlation Chart
The statistical analysis conducted on geographies consisting of 224,034,361 people shows a significant negative correlation between the proportion of Navajo and percentage of population with at least professional degree education in the United States with a correlation coefficient (R) of -0.615 and weighted average of 2.9%. Similarly, the statistical analysis conducted on geographies consisting of 270,711,574 people shows a poor negative correlation between the proportion of Immigrants from Ecuador and percentage of population with at least professional degree education in the United States with a correlation coefficient (R) of -0.192 and weighted average of 3.8%, a difference of 32.4%.
Professional Degree Correlation Summary
| Measurement | Navajo | Immigrants from Ecuador |
| Minimum | 0.11% | 0.70% |
| Maximum | 9.8% | 6.9% |
| Range | 9.7% | 6.2% |
| Mean | 2.3% | 3.2% |
| Median | 1.9% | 3.1% |
| Interquartile 25% (IQ1) | 0.96% | 2.3% |
| Interquartile 75% (IQ3) | 2.9% | 4.1% |
| Interquartile Range (IQR) | 1.9% | 1.7% |
| Standard Deviation (Sample) | 1.8% | 1.3% |
| Standard Deviation (Population) | 1.8% | 1.2% |
Similar Demographics by Professional Degree
Demographics Similar to Navajo by Professional Degree
In terms of professional degree, the demographic groups most similar to Navajo are Arapaho (2.9%, a difference of 0.070%), Immigrants from Central America (2.9%, a difference of 0.12%), Yup'ik (2.9%, a difference of 0.17%), Tohono O'odham (2.8%, a difference of 0.95%), and Immigrants from the Azores (2.8%, a difference of 1.6%).
| Demographics | Rating | Rank | Professional Degree |
| Kiowa | 0.0 /100 | #331 | Tragic 3.1% |
| Yakama | 0.0 /100 | #332 | Tragic 3.1% |
| Puget Sound Salish | 0.0 /100 | #333 | Tragic 3.1% |
| Pennsylvania Germans | 0.0 /100 | #334 | Tragic 3.0% |
| Natives/Alaskans | 0.0 /100 | #335 | Tragic 3.0% |
| Fijians | 0.0 /100 | #336 | Tragic 2.9% |
| Arapaho | 0.0 /100 | #337 | Tragic 2.9% |
| Navajo | 0.0 /100 | #338 | Tragic 2.9% |
| Immigrants | Central America | 0.0 /100 | #339 | Tragic 2.9% |
| Yup'ik | 0.0 /100 | #340 | Tragic 2.9% |
| Tohono O'odham | 0.0 /100 | #341 | Tragic 2.8% |
| Immigrants | Azores | 0.0 /100 | #342 | Tragic 2.8% |
| Mexicans | 0.0 /100 | #343 | Tragic 2.7% |
| Spanish American Indians | 0.0 /100 | #344 | Tragic 2.7% |
| Immigrants | Mexico | 0.0 /100 | #345 | Tragic 2.6% |
Demographics Similar to Immigrants from Ecuador by Professional Degree
In terms of professional degree, the demographic groups most similar to Immigrants from Ecuador are Alaskan Athabascan (3.8%, a difference of 0.020%), Native Hawaiian (3.8%, a difference of 0.020%), Guamanian/Chamorro (3.8%, a difference of 0.10%), British West Indian (3.8%, a difference of 0.23%), and Immigrants from Bahamas (3.8%, a difference of 0.53%).
| Demographics | Rating | Rank | Professional Degree |
| Immigrants | Philippines | 4.1 /100 | #233 | Tragic 3.9% |
| Immigrants | Nonimmigrants | 4.0 /100 | #234 | Tragic 3.9% |
| Immigrants | Barbados | 4.0 /100 | #235 | Tragic 3.9% |
| Spanish Americans | 3.8 /100 | #236 | Tragic 3.9% |
| Immigrants | Trinidad and Tobago | 3.8 /100 | #237 | Tragic 3.9% |
| Colville | 2.6 /100 | #238 | Tragic 3.8% |
| British West Indians | 2.4 /100 | #239 | Tragic 3.8% |
| Immigrants | Ecuador | 2.3 /100 | #240 | Tragic 3.8% |
| Alaskan Athabascans | 2.3 /100 | #241 | Tragic 3.8% |
| Native Hawaiians | 2.3 /100 | #242 | Tragic 3.8% |
| Guamanians/Chamorros | 2.2 /100 | #243 | Tragic 3.8% |
| Immigrants | Bahamas | 2.0 /100 | #244 | Tragic 3.8% |
| French American Indians | 1.7 /100 | #245 | Tragic 3.8% |
| Marshallese | 1.7 /100 | #246 | Tragic 3.8% |
| Guyanese | 1.6 /100 | #247 | Tragic 3.8% |