Navajo vs Immigrants from Zimbabwe GED/Equivalency
COMPARE
Navajo
Immigrants from Zimbabwe
GED/Equivalency
GED/Equivalency Comparison
Navajo
Immigrants from Zimbabwe
81.5%
GED/EQUIVALENCY
0.0/ 100
METRIC RATING
304th/ 347
METRIC RANK
87.1%
GED/EQUIVALENCY
95.8/ 100
METRIC RATING
106th/ 347
METRIC RANK
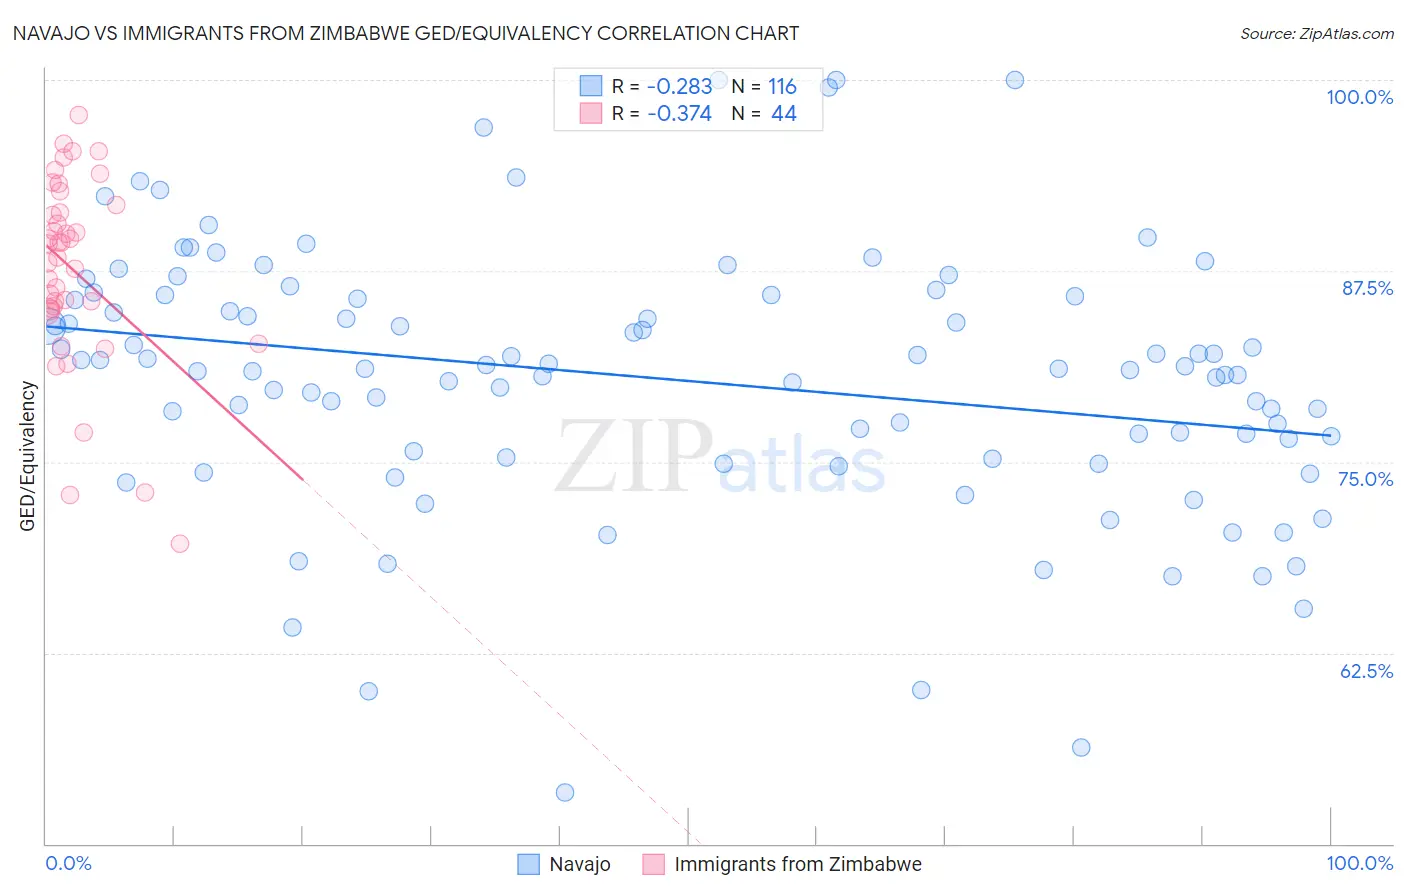
Navajo vs Immigrants from Zimbabwe GED/Equivalency Correlation Chart
The statistical analysis conducted on geographies consisting of 224,872,856 people shows a weak negative correlation between the proportion of Navajo and percentage of population with at least ged/equivalency education in the United States with a correlation coefficient (R) of -0.283 and weighted average of 81.5%. Similarly, the statistical analysis conducted on geographies consisting of 117,809,864 people shows a mild negative correlation between the proportion of Immigrants from Zimbabwe and percentage of population with at least ged/equivalency education in the United States with a correlation coefficient (R) of -0.374 and weighted average of 87.1%, a difference of 6.9%.
GED/Equivalency Correlation Summary
| Measurement | Navajo | Immigrants from Zimbabwe |
| Minimum | 53.3% | 69.6% |
| Maximum | 100.0% | 97.7% |
| Range | 46.7% | 28.1% |
| Mean | 80.4% | 87.5% |
| Median | 81.1% | 88.8% |
| Interquartile 25% (IQ1) | 75.5% | 84.9% |
| Interquartile 75% (IQ3) | 85.8% | 91.6% |
| Interquartile Range (IQR) | 10.3% | 6.6% |
| Standard Deviation (Sample) | 8.6% | 6.2% |
| Standard Deviation (Population) | 8.5% | 6.2% |
Similar Demographics by GED/Equivalency
Demographics Similar to Navajo by GED/Equivalency
In terms of ged/equivalency, the demographic groups most similar to Navajo are Immigrants from Haiti (81.6%, a difference of 0.10%), Immigrants from Portugal (81.6%, a difference of 0.10%), Dutch West Indian (81.6%, a difference of 0.14%), Fijian (81.6%, a difference of 0.20%), and Immigrants from Grenada (81.3%, a difference of 0.21%).
| Demographics | Rating | Rank | GED/Equivalency |
| Immigrants | Bangladesh | 0.0 /100 | #297 | Tragic 81.9% |
| Ute | 0.0 /100 | #298 | Tragic 81.8% |
| Ecuadorians | 0.0 /100 | #299 | Tragic 81.7% |
| Fijians | 0.0 /100 | #300 | Tragic 81.6% |
| Dutch West Indians | 0.0 /100 | #301 | Tragic 81.6% |
| Immigrants | Haiti | 0.0 /100 | #302 | Tragic 81.6% |
| Immigrants | Portugal | 0.0 /100 | #303 | Tragic 81.6% |
| Navajo | 0.0 /100 | #304 | Tragic 81.5% |
| Immigrants | Grenada | 0.0 /100 | #305 | Tragic 81.3% |
| Guyanese | 0.0 /100 | #306 | Tragic 81.3% |
| Immigrants | Dominica | 0.0 /100 | #307 | Tragic 81.1% |
| Puerto Ricans | 0.0 /100 | #308 | Tragic 81.1% |
| Immigrants | Ecuador | 0.0 /100 | #309 | Tragic 81.0% |
| Immigrants | Guyana | 0.0 /100 | #310 | Tragic 81.0% |
| Natives/Alaskans | 0.0 /100 | #311 | Tragic 80.9% |
Demographics Similar to Immigrants from Zimbabwe by GED/Equivalency
In terms of ged/equivalency, the demographic groups most similar to Immigrants from Zimbabwe are Icelander (87.1%, a difference of 0.010%), Indian (Asian) (87.1%, a difference of 0.020%), Immigrants from Hungary (87.2%, a difference of 0.030%), Canadian (87.1%, a difference of 0.030%), and Jordanian (87.2%, a difference of 0.040%).
| Demographics | Rating | Rank | GED/Equivalency |
| Immigrants | Belarus | 96.9 /100 | #99 | Exceptional 87.3% |
| Palestinians | 96.8 /100 | #100 | Exceptional 87.3% |
| Syrians | 96.6 /100 | #101 | Exceptional 87.2% |
| Lebanese | 96.2 /100 | #102 | Exceptional 87.2% |
| Jordanians | 96.1 /100 | #103 | Exceptional 87.2% |
| Immigrants | Hungary | 96.0 /100 | #104 | Exceptional 87.2% |
| Indians (Asian) | 95.9 /100 | #105 | Exceptional 87.1% |
| Immigrants | Zimbabwe | 95.8 /100 | #106 | Exceptional 87.1% |
| Icelanders | 95.7 /100 | #107 | Exceptional 87.1% |
| Canadians | 95.6 /100 | #108 | Exceptional 87.1% |
| Immigrants | Eastern Europe | 95.5 /100 | #109 | Exceptional 87.1% |
| Egyptians | 95.3 /100 | #110 | Exceptional 87.1% |
| French | 95.2 /100 | #111 | Exceptional 87.1% |
| Tlingit-Haida | 94.8 /100 | #112 | Exceptional 87.0% |
| Assyrians/Chaldeans/Syriacs | 94.8 /100 | #113 | Exceptional 87.0% |