Navajo vs Carpatho Rusyn GED/Equivalency
COMPARE
Navajo
Carpatho Rusyn
GED/Equivalency
GED/Equivalency Comparison
Navajo
Carpatho Rusyns
81.5%
GED/EQUIVALENCY
0.0/ 100
METRIC RATING
304th/ 347
METRIC RANK
89.1%
GED/EQUIVALENCY
99.9/ 100
METRIC RATING
8th/ 347
METRIC RANK
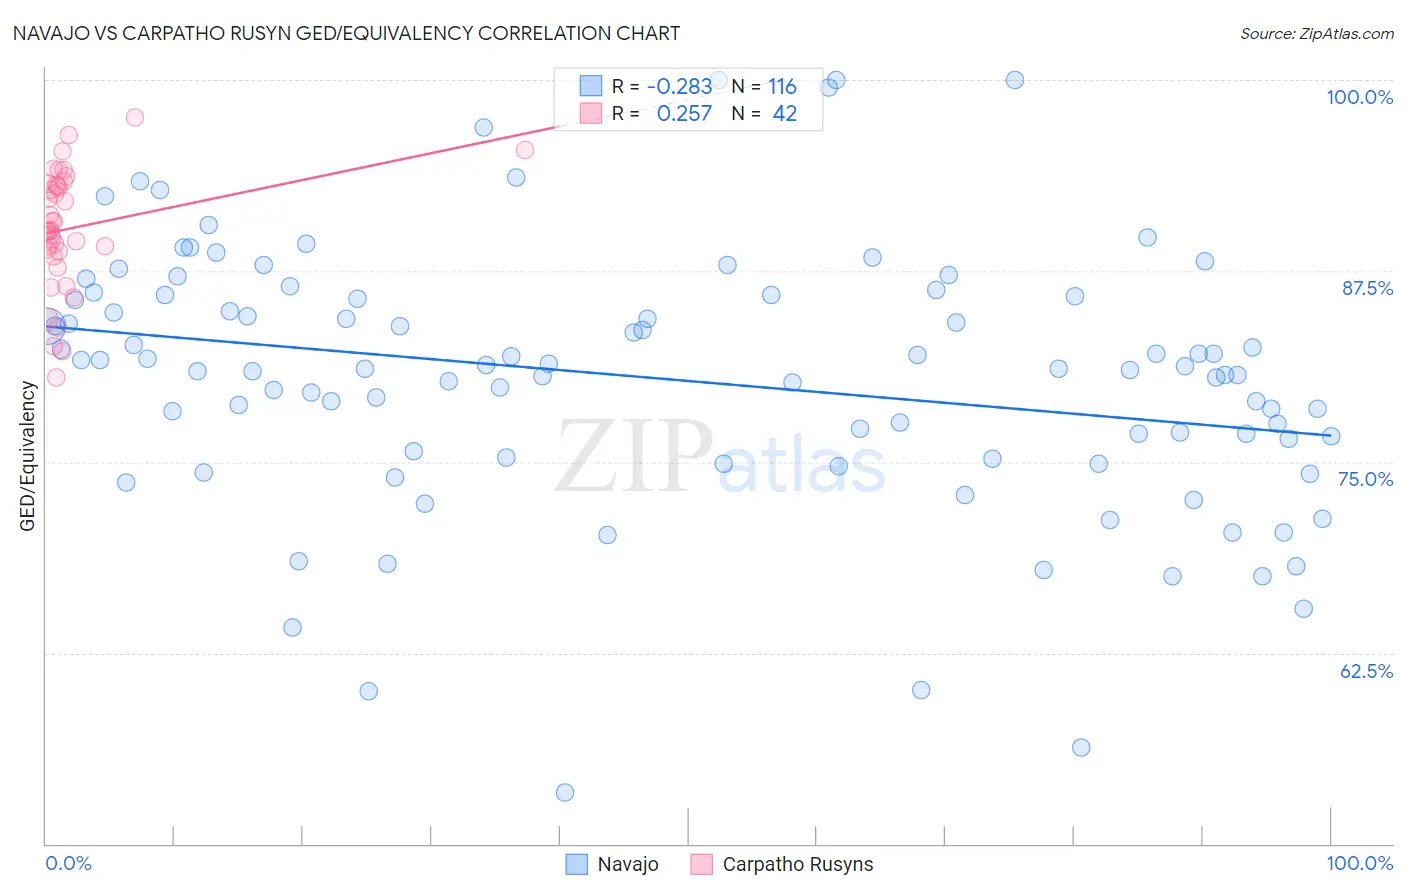
Navajo vs Carpatho Rusyn GED/Equivalency Correlation Chart
The statistical analysis conducted on geographies consisting of 224,872,856 people shows a weak negative correlation between the proportion of Navajo and percentage of population with at least ged/equivalency education in the United States with a correlation coefficient (R) of -0.283 and weighted average of 81.5%. Similarly, the statistical analysis conducted on geographies consisting of 58,871,690 people shows a weak positive correlation between the proportion of Carpatho Rusyns and percentage of population with at least ged/equivalency education in the United States with a correlation coefficient (R) of 0.257 and weighted average of 89.1%, a difference of 9.3%.
GED/Equivalency Correlation Summary
| Measurement | Navajo | Carpatho Rusyn |
| Minimum | 53.3% | 80.5% |
| Maximum | 100.0% | 97.5% |
| Range | 46.7% | 17.0% |
| Mean | 80.4% | 90.3% |
| Median | 81.1% | 90.2% |
| Interquartile 25% (IQ1) | 75.5% | 88.8% |
| Interquartile 75% (IQ3) | 85.8% | 93.2% |
| Interquartile Range (IQR) | 10.3% | 4.3% |
| Standard Deviation (Sample) | 8.6% | 3.9% |
| Standard Deviation (Population) | 8.5% | 3.9% |
Similar Demographics by GED/Equivalency
Demographics Similar to Navajo by GED/Equivalency
In terms of ged/equivalency, the demographic groups most similar to Navajo are Immigrants from Haiti (81.6%, a difference of 0.10%), Immigrants from Portugal (81.6%, a difference of 0.10%), Dutch West Indian (81.6%, a difference of 0.14%), Fijian (81.6%, a difference of 0.20%), and Immigrants from Grenada (81.3%, a difference of 0.21%).
| Demographics | Rating | Rank | GED/Equivalency |
| Immigrants | Bangladesh | 0.0 /100 | #297 | Tragic 81.9% |
| Ute | 0.0 /100 | #298 | Tragic 81.8% |
| Ecuadorians | 0.0 /100 | #299 | Tragic 81.7% |
| Fijians | 0.0 /100 | #300 | Tragic 81.6% |
| Dutch West Indians | 0.0 /100 | #301 | Tragic 81.6% |
| Immigrants | Haiti | 0.0 /100 | #302 | Tragic 81.6% |
| Immigrants | Portugal | 0.0 /100 | #303 | Tragic 81.6% |
| Navajo | 0.0 /100 | #304 | Tragic 81.5% |
| Immigrants | Grenada | 0.0 /100 | #305 | Tragic 81.3% |
| Guyanese | 0.0 /100 | #306 | Tragic 81.3% |
| Immigrants | Dominica | 0.0 /100 | #307 | Tragic 81.1% |
| Puerto Ricans | 0.0 /100 | #308 | Tragic 81.1% |
| Immigrants | Ecuador | 0.0 /100 | #309 | Tragic 81.0% |
| Immigrants | Guyana | 0.0 /100 | #310 | Tragic 81.0% |
| Natives/Alaskans | 0.0 /100 | #311 | Tragic 80.9% |
Demographics Similar to Carpatho Rusyns by GED/Equivalency
In terms of ged/equivalency, the demographic groups most similar to Carpatho Rusyns are Chinese (89.0%, a difference of 0.020%), Eastern European (89.1%, a difference of 0.050%), Norwegian (89.0%, a difference of 0.070%), Thai (89.1%, a difference of 0.090%), and Bulgarian (89.0%, a difference of 0.10%).
| Demographics | Rating | Rank | GED/Equivalency |
| Immigrants | India | 100.0 /100 | #1 | Exceptional 89.7% |
| Filipinos | 100.0 /100 | #2 | Exceptional 89.5% |
| Immigrants | Singapore | 100.0 /100 | #3 | Exceptional 89.3% |
| Iranians | 100.0 /100 | #4 | Exceptional 89.2% |
| Latvians | 100.0 /100 | #5 | Exceptional 89.2% |
| Thais | 100.0 /100 | #6 | Exceptional 89.1% |
| Eastern Europeans | 99.9 /100 | #7 | Exceptional 89.1% |
| Carpatho Rusyns | 99.9 /100 | #8 | Exceptional 89.1% |
| Chinese | 99.9 /100 | #9 | Exceptional 89.0% |
| Norwegians | 99.9 /100 | #10 | Exceptional 89.0% |
| Bulgarians | 99.9 /100 | #11 | Exceptional 89.0% |
| Lithuanians | 99.9 /100 | #12 | Exceptional 88.9% |
| Immigrants | Iran | 99.9 /100 | #13 | Exceptional 88.9% |
| Cypriots | 99.9 /100 | #14 | Exceptional 88.9% |
| Okinawans | 99.9 /100 | #15 | Exceptional 88.9% |