Navajo vs Immigrants from Korea Median Female Earnings
COMPARE
Navajo
Immigrants from Korea
Median Female Earnings
Median Female Earnings Comparison
Navajo
Immigrants from Korea
$33,046
MEDIAN FEMALE EARNINGS
0.0/ 100
METRIC RATING
341st/ 347
METRIC RANK
$44,847
MEDIAN FEMALE EARNINGS
100.0/ 100
METRIC RATING
24th/ 347
METRIC RANK
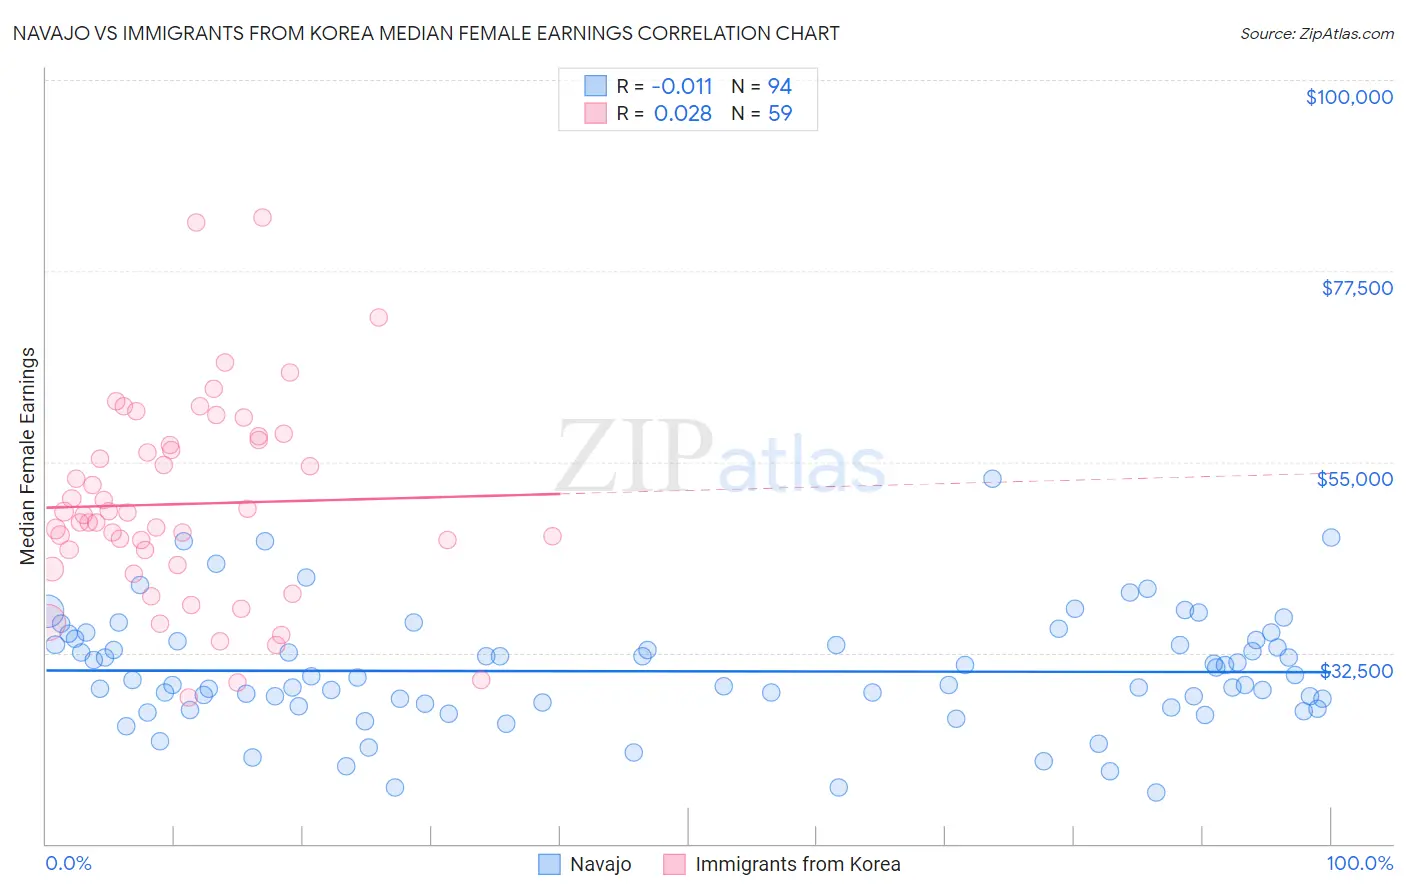
Navajo vs Immigrants from Korea Median Female Earnings Correlation Chart
The statistical analysis conducted on geographies consisting of 224,729,121 people shows no correlation between the proportion of Navajo and median female earnings in the United States with a correlation coefficient (R) of -0.011 and weighted average of $33,046. Similarly, the statistical analysis conducted on geographies consisting of 416,108,696 people shows no correlation between the proportion of Immigrants from Korea and median female earnings in the United States with a correlation coefficient (R) of 0.028 and weighted average of $44,847, a difference of 35.7%.
Median Female Earnings Correlation Summary
| Measurement | Navajo | Immigrants from Korea |
| Minimum | $16,070 | $27,183 |
| Maximum | $52,969 | $83,750 |
| Range | $36,899 | $56,567 |
| Mean | $30,327 | $50,048 |
| Median | $29,421 | $48,754 |
| Interquartile 25% (IQ1) | $26,466 | $42,787 |
| Interquartile 75% (IQ3) | $33,883 | $57,558 |
| Interquartile Range (IQR) | $7,417 | $14,771 |
| Standard Deviation (Sample) | $6,718 | $11,764 |
| Standard Deviation (Population) | $6,682 | $11,664 |
Similar Demographics by Median Female Earnings
Demographics Similar to Navajo by Median Female Earnings
In terms of median female earnings, the demographic groups most similar to Navajo are Tohono O'odham ($33,205, a difference of 0.48%), Immigrants from Mexico ($33,236, a difference of 0.57%), Immigrants from Cuba ($33,291, a difference of 0.74%), Yakama ($33,354, a difference of 0.93%), and Yup'ik ($32,730, a difference of 0.96%).
| Demographics | Rating | Rank | Median Female Earnings |
| Mexicans | 0.0 /100 | #333 | Tragic $33,664 |
| Spanish American Indians | 0.0 /100 | #334 | Tragic $33,625 |
| Creek | 0.0 /100 | #335 | Tragic $33,437 |
| Ottawa | 0.0 /100 | #336 | Tragic $33,378 |
| Yakama | 0.0 /100 | #337 | Tragic $33,354 |
| Immigrants | Cuba | 0.0 /100 | #338 | Tragic $33,291 |
| Immigrants | Mexico | 0.0 /100 | #339 | Tragic $33,236 |
| Tohono O'odham | 0.0 /100 | #340 | Tragic $33,205 |
| Navajo | 0.0 /100 | #341 | Tragic $33,046 |
| Yup'ik | 0.0 /100 | #342 | Tragic $32,730 |
| Pueblo | 0.0 /100 | #343 | Tragic $32,564 |
| Lumbee | 0.0 /100 | #344 | Tragic $32,500 |
| Puerto Ricans | 0.0 /100 | #345 | Tragic $31,560 |
| Arapaho | 0.0 /100 | #346 | Tragic $31,489 |
| Houma | 0.0 /100 | #347 | Tragic $30,343 |
Demographics Similar to Immigrants from Korea by Median Female Earnings
In terms of median female earnings, the demographic groups most similar to Immigrants from Korea are Burmese ($44,911, a difference of 0.14%), Immigrants from Sweden ($44,774, a difference of 0.16%), Immigrants from Belarus ($44,757, a difference of 0.20%), Immigrants from Greece ($44,976, a difference of 0.29%), and Turkish ($44,695, a difference of 0.34%).
| Demographics | Rating | Rank | Median Female Earnings |
| Immigrants | South Central Asia | 100.0 /100 | #17 | Exceptional $46,324 |
| Cypriots | 100.0 /100 | #18 | Exceptional $45,570 |
| Eastern Europeans | 100.0 /100 | #19 | Exceptional $45,385 |
| Immigrants | Japan | 100.0 /100 | #20 | Exceptional $45,323 |
| Cambodians | 100.0 /100 | #21 | Exceptional $45,014 |
| Immigrants | Greece | 100.0 /100 | #22 | Exceptional $44,976 |
| Burmese | 100.0 /100 | #23 | Exceptional $44,911 |
| Immigrants | Korea | 100.0 /100 | #24 | Exceptional $44,847 |
| Immigrants | Sweden | 100.0 /100 | #25 | Exceptional $44,774 |
| Immigrants | Belarus | 100.0 /100 | #26 | Exceptional $44,757 |
| Turks | 100.0 /100 | #27 | Exceptional $44,695 |
| Immigrants | Russia | 100.0 /100 | #28 | Exceptional $44,680 |
| Immigrants | Belgium | 100.0 /100 | #29 | Exceptional $44,587 |
| Asians | 100.0 /100 | #30 | Exceptional $44,586 |
| Immigrants | France | 100.0 /100 | #31 | Exceptional $44,541 |