Native/Alaskan vs Immigrants from Hungary College, Under 1 year
COMPARE
Native/Alaskan
Immigrants from Hungary
College, Under 1 year
College, Under 1 year Comparison
Natives/Alaskans
Immigrants from Hungary
56.6%
COLLEGE, UNDER 1 YEAR
0.0/ 100
METRIC RATING
321st/ 347
METRIC RANK
68.3%
COLLEGE, UNDER 1 YEAR
98.3/ 100
METRIC RATING
84th/ 347
METRIC RANK
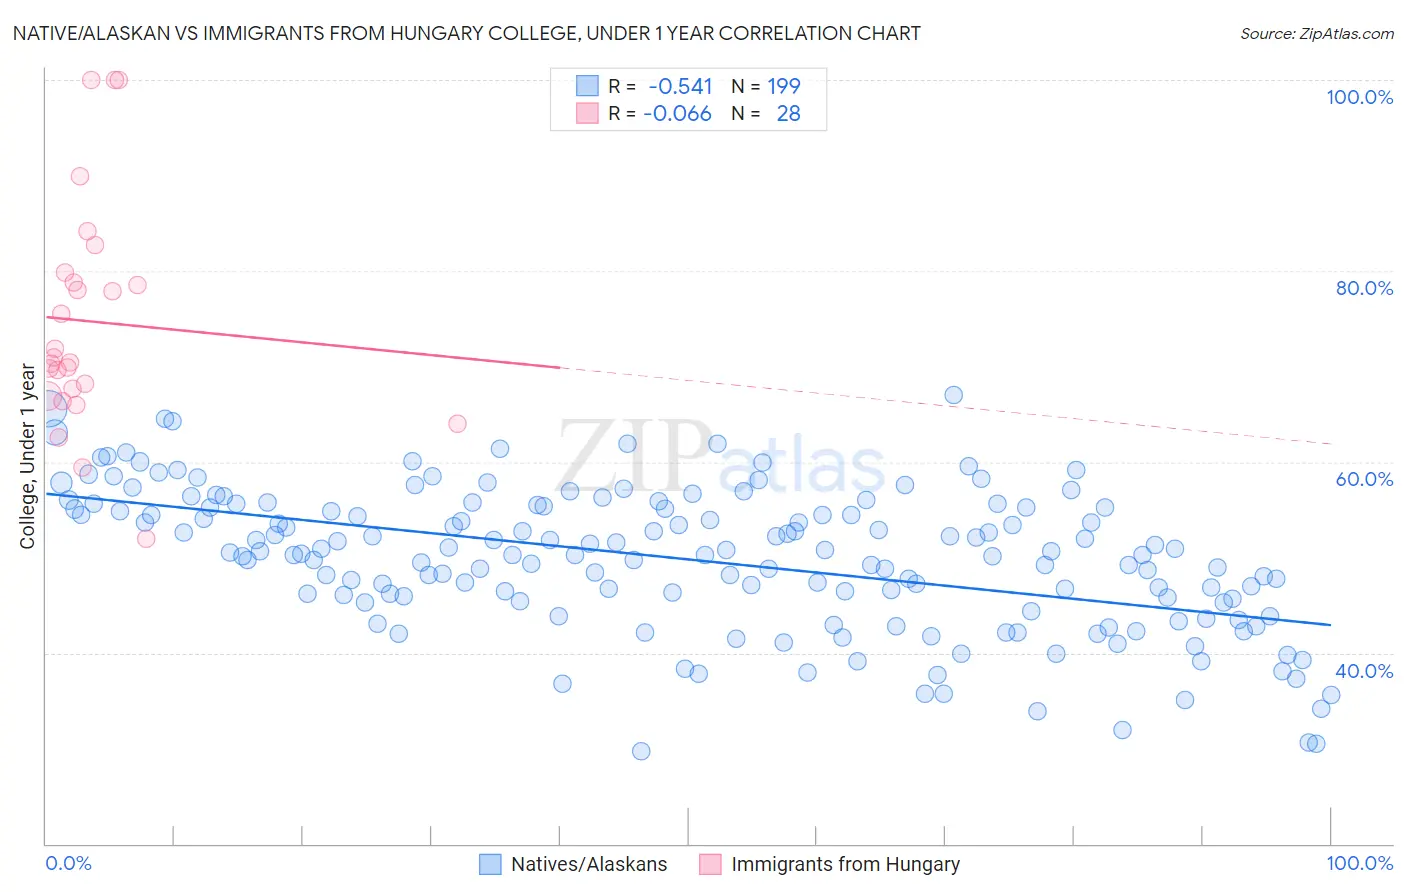
Native/Alaskan vs Immigrants from Hungary College, Under 1 year Correlation Chart
The statistical analysis conducted on geographies consisting of 513,071,269 people shows a substantial negative correlation between the proportion of Natives/Alaskans and percentage of population with at least college, under 1 year education in the United States with a correlation coefficient (R) of -0.541 and weighted average of 56.6%. Similarly, the statistical analysis conducted on geographies consisting of 195,707,305 people shows a slight negative correlation between the proportion of Immigrants from Hungary and percentage of population with at least college, under 1 year education in the United States with a correlation coefficient (R) of -0.066 and weighted average of 68.3%, a difference of 20.7%.
College, Under 1 year Correlation Summary
| Measurement | Native/Alaskan | Immigrants from Hungary |
| Minimum | 29.7% | 52.0% |
| Maximum | 67.0% | 100.0% |
| Range | 37.4% | 48.0% |
| Mean | 49.8% | 74.7% |
| Median | 50.4% | 70.7% |
| Interquartile 25% (IQ1) | 45.4% | 67.3% |
| Interquartile 75% (IQ3) | 55.2% | 79.3% |
| Interquartile Range (IQR) | 9.8% | 12.1% |
| Standard Deviation (Sample) | 7.4% | 11.9% |
| Standard Deviation (Population) | 7.4% | 11.7% |
Similar Demographics by College, Under 1 year
Demographics Similar to Natives/Alaskans by College, Under 1 year
In terms of college, under 1 year, the demographic groups most similar to Natives/Alaskans are Immigrants from Caribbean (56.6%, a difference of 0.13%), Guatemalan (56.8%, a difference of 0.26%), Immigrants from Honduras (56.5%, a difference of 0.31%), Puerto Rican (56.8%, a difference of 0.32%), and Immigrants from El Salvador (56.4%, a difference of 0.44%).
| Demographics | Rating | Rank | College, Under 1 year |
| Hopi | 0.0 /100 | #314 | Tragic 57.1% |
| Hondurans | 0.0 /100 | #315 | Tragic 57.1% |
| Menominee | 0.0 /100 | #316 | Tragic 57.0% |
| Hispanics or Latinos | 0.0 /100 | #317 | Tragic 57.0% |
| Immigrants | Haiti | 0.0 /100 | #318 | Tragic 56.9% |
| Puerto Ricans | 0.0 /100 | #319 | Tragic 56.8% |
| Guatemalans | 0.0 /100 | #320 | Tragic 56.8% |
| Natives/Alaskans | 0.0 /100 | #321 | Tragic 56.6% |
| Immigrants | Caribbean | 0.0 /100 | #322 | Tragic 56.6% |
| Immigrants | Honduras | 0.0 /100 | #323 | Tragic 56.5% |
| Immigrants | El Salvador | 0.0 /100 | #324 | Tragic 56.4% |
| Immigrants | Latin America | 0.0 /100 | #325 | Tragic 56.3% |
| Navajo | 0.0 /100 | #326 | Tragic 56.3% |
| Immigrants | Guatemala | 0.0 /100 | #327 | Tragic 56.2% |
| Cape Verdeans | 0.0 /100 | #328 | Tragic 56.0% |
Demographics Similar to Immigrants from Hungary by College, Under 1 year
In terms of college, under 1 year, the demographic groups most similar to Immigrants from Hungary are Egyptian (68.3%, a difference of 0.010%), Immigrants from Lebanon (68.3%, a difference of 0.010%), Argentinean (68.4%, a difference of 0.020%), Chinese (68.3%, a difference of 0.030%), and Norwegian (68.4%, a difference of 0.040%).
| Demographics | Rating | Rank | College, Under 1 year |
| British | 98.6 /100 | #77 | Exceptional 68.5% |
| Danes | 98.6 /100 | #78 | Exceptional 68.5% |
| Greeks | 98.6 /100 | #79 | Exceptional 68.5% |
| Immigrants | Spain | 98.5 /100 | #80 | Exceptional 68.4% |
| Immigrants | Greece | 98.5 /100 | #81 | Exceptional 68.4% |
| Norwegians | 98.4 /100 | #82 | Exceptional 68.4% |
| Argentineans | 98.4 /100 | #83 | Exceptional 68.4% |
| Immigrants | Hungary | 98.3 /100 | #84 | Exceptional 68.3% |
| Egyptians | 98.3 /100 | #85 | Exceptional 68.3% |
| Immigrants | Lebanon | 98.3 /100 | #86 | Exceptional 68.3% |
| Chinese | 98.3 /100 | #87 | Exceptional 68.3% |
| Croatians | 98.2 /100 | #88 | Exceptional 68.3% |
| Ethiopians | 98.2 /100 | #89 | Exceptional 68.3% |
| Icelanders | 98.1 /100 | #90 | Exceptional 68.3% |
| Europeans | 98.1 /100 | #91 | Exceptional 68.2% |