Native/Alaskan vs Immigrants from Burma/Myanmar Unemployment Among Women with Children Under 18 years
COMPARE
Native/Alaskan
Immigrants from Burma/Myanmar
Unemployment Among Women with Children Under 18 years
Unemployment Among Women with Children Under 18 years Comparison
Natives/Alaskans
Immigrants from Burma/Myanmar
7.2%
UNEMPLOYMENT AMONG WOMEN WITH CHILDREN UNDER 18 YEARS
0.0/ 100
METRIC RATING
328th/ 347
METRIC RANK
5.4%
UNEMPLOYMENT AMONG WOMEN WITH CHILDREN UNDER 18 YEARS
69.5/ 100
METRIC RATING
158th/ 347
METRIC RANK
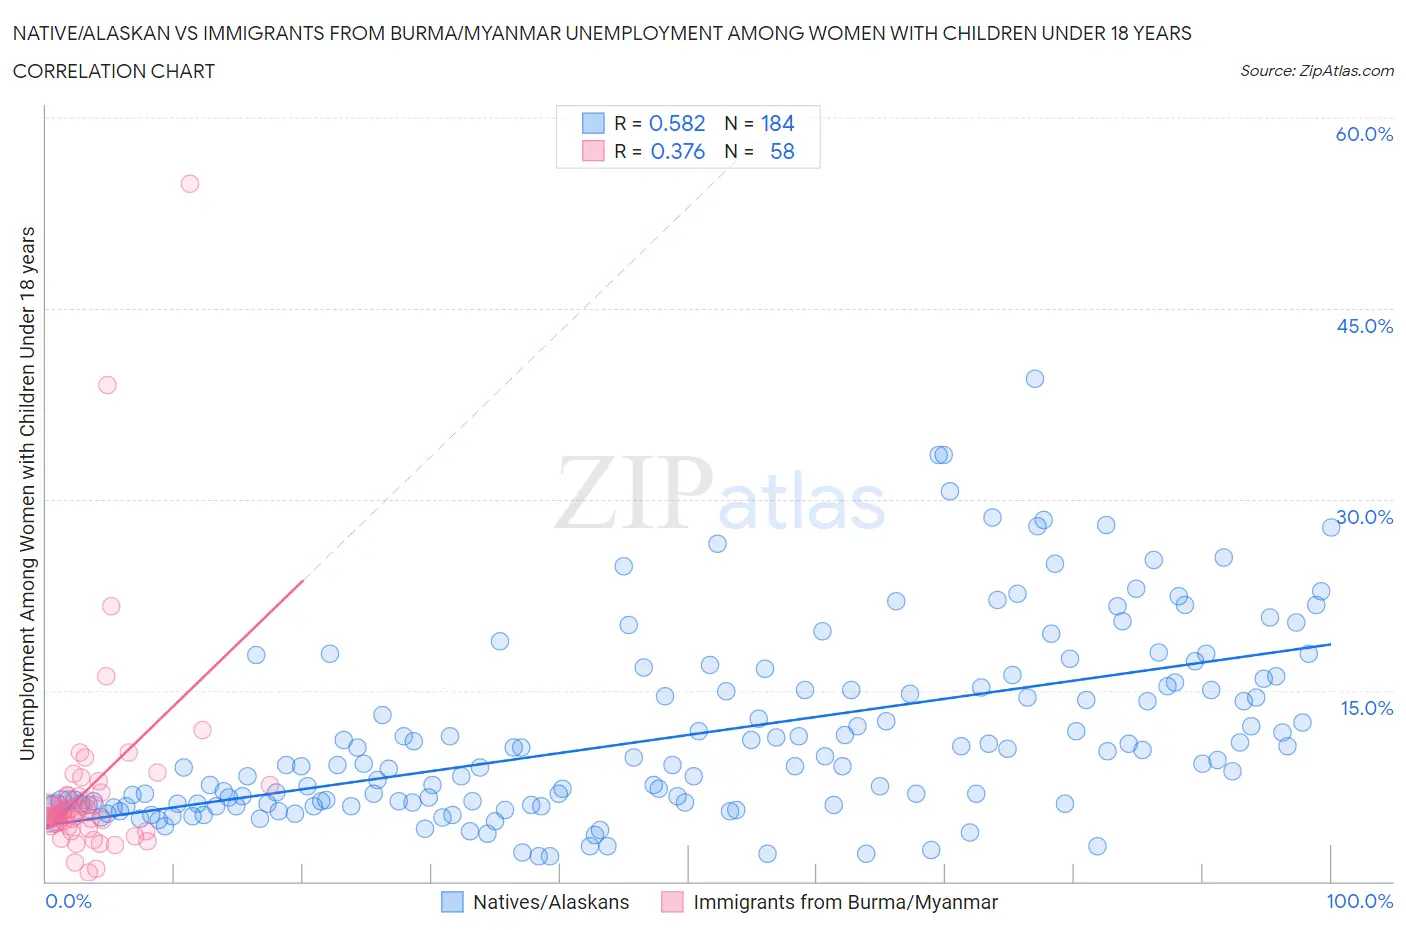
Native/Alaskan vs Immigrants from Burma/Myanmar Unemployment Among Women with Children Under 18 years Correlation Chart
The statistical analysis conducted on geographies consisting of 478,925,590 people shows a substantial positive correlation between the proportion of Natives/Alaskans and unemployment rate among women with children under the age of 18 in the United States with a correlation coefficient (R) of 0.582 and weighted average of 7.2%. Similarly, the statistical analysis conducted on geographies consisting of 170,433,276 people shows a mild positive correlation between the proportion of Immigrants from Burma/Myanmar and unemployment rate among women with children under the age of 18 in the United States with a correlation coefficient (R) of 0.376 and weighted average of 5.4%, a difference of 35.1%.
Unemployment Among Women with Children Under 18 years Correlation Summary
| Measurement | Native/Alaskan | Immigrants from Burma/Myanmar |
| Minimum | 1.9% | 0.70% |
| Maximum | 39.5% | 54.8% |
| Range | 37.5% | 54.1% |
| Mean | 11.4% | 7.3% |
| Median | 9.1% | 5.3% |
| Interquartile 25% (IQ1) | 6.0% | 4.3% |
| Interquartile 75% (IQ3) | 15.1% | 6.8% |
| Interquartile Range (IQR) | 9.1% | 2.5% |
| Standard Deviation (Sample) | 7.3% | 8.4% |
| Standard Deviation (Population) | 7.3% | 8.3% |
Similar Demographics by Unemployment Among Women with Children Under 18 years
Demographics Similar to Natives/Alaskans by Unemployment Among Women with Children Under 18 years
In terms of unemployment among women with children under 18 years, the demographic groups most similar to Natives/Alaskans are Black/African American (7.3%, a difference of 0.41%), Colville (7.4%, a difference of 1.9%), Lumbee (7.1%, a difference of 2.4%), Hopi (7.4%, a difference of 2.4%), and Dominican (7.5%, a difference of 3.0%).
| Demographics | Rating | Rank | Unemployment Among Women with Children Under 18 years |
| U.S. Virgin Islanders | 0.0 /100 | #321 | Tragic 6.7% |
| Houma | 0.0 /100 | #322 | Tragic 6.8% |
| Pueblo | 0.0 /100 | #323 | Tragic 6.8% |
| Paiute | 0.0 /100 | #324 | Tragic 6.9% |
| Immigrants | Dominica | 0.0 /100 | #325 | Tragic 7.0% |
| Chippewa | 0.0 /100 | #326 | Tragic 7.0% |
| Lumbee | 0.0 /100 | #327 | Tragic 7.1% |
| Natives/Alaskans | 0.0 /100 | #328 | Tragic 7.2% |
| Blacks/African Americans | 0.0 /100 | #329 | Tragic 7.3% |
| Colville | 0.0 /100 | #330 | Tragic 7.4% |
| Hopi | 0.0 /100 | #331 | Tragic 7.4% |
| Dominicans | 0.0 /100 | #332 | Tragic 7.5% |
| Immigrants | Dominican Republic | 0.0 /100 | #333 | Tragic 7.5% |
| Cheyenne | 0.0 /100 | #334 | Tragic 7.8% |
| Apache | 0.0 /100 | #335 | Tragic 7.9% |
Demographics Similar to Immigrants from Burma/Myanmar by Unemployment Among Women with Children Under 18 years
In terms of unemployment among women with children under 18 years, the demographic groups most similar to Immigrants from Burma/Myanmar are German Russian (5.4%, a difference of 0.060%), South African (5.4%, a difference of 0.070%), Korean (5.4%, a difference of 0.090%), Chickasaw (5.4%, a difference of 0.090%), and Carpatho Rusyn (5.4%, a difference of 0.11%).
| Demographics | Rating | Rank | Unemployment Among Women with Children Under 18 years |
| Immigrants | Iran | 71.1 /100 | #151 | Good 5.4% |
| Immigrants | South Eastern Asia | 71.1 /100 | #152 | Good 5.4% |
| Carpatho Rusyns | 70.8 /100 | #153 | Good 5.4% |
| Immigrants | Latvia | 70.8 /100 | #154 | Good 5.4% |
| Koreans | 70.5 /100 | #155 | Good 5.4% |
| South Africans | 70.3 /100 | #156 | Good 5.4% |
| German Russians | 70.2 /100 | #157 | Good 5.4% |
| Immigrants | Burma/Myanmar | 69.5 /100 | #158 | Good 5.4% |
| Chickasaw | 68.4 /100 | #159 | Good 5.4% |
| Afghans | 66.6 /100 | #160 | Good 5.4% |
| Immigrants | Iraq | 65.9 /100 | #161 | Good 5.4% |
| Immigrants | Saudi Arabia | 65.0 /100 | #162 | Good 5.4% |
| Lebanese | 64.7 /100 | #163 | Good 5.4% |
| Celtics | 63.0 /100 | #164 | Good 5.4% |
| Tlingit-Haida | 61.9 /100 | #165 | Good 5.4% |