Native/Alaskan vs Immigrants from Eastern Asia College, Under 1 year
COMPARE
Native/Alaskan
Immigrants from Eastern Asia
College, Under 1 year
College, Under 1 year Comparison
Natives/Alaskans
Immigrants from Eastern Asia
56.6%
COLLEGE, UNDER 1 YEAR
0.0/ 100
METRIC RATING
321st/ 347
METRIC RANK
71.3%
COLLEGE, UNDER 1 YEAR
100.0/ 100
METRIC RATING
22nd/ 347
METRIC RANK
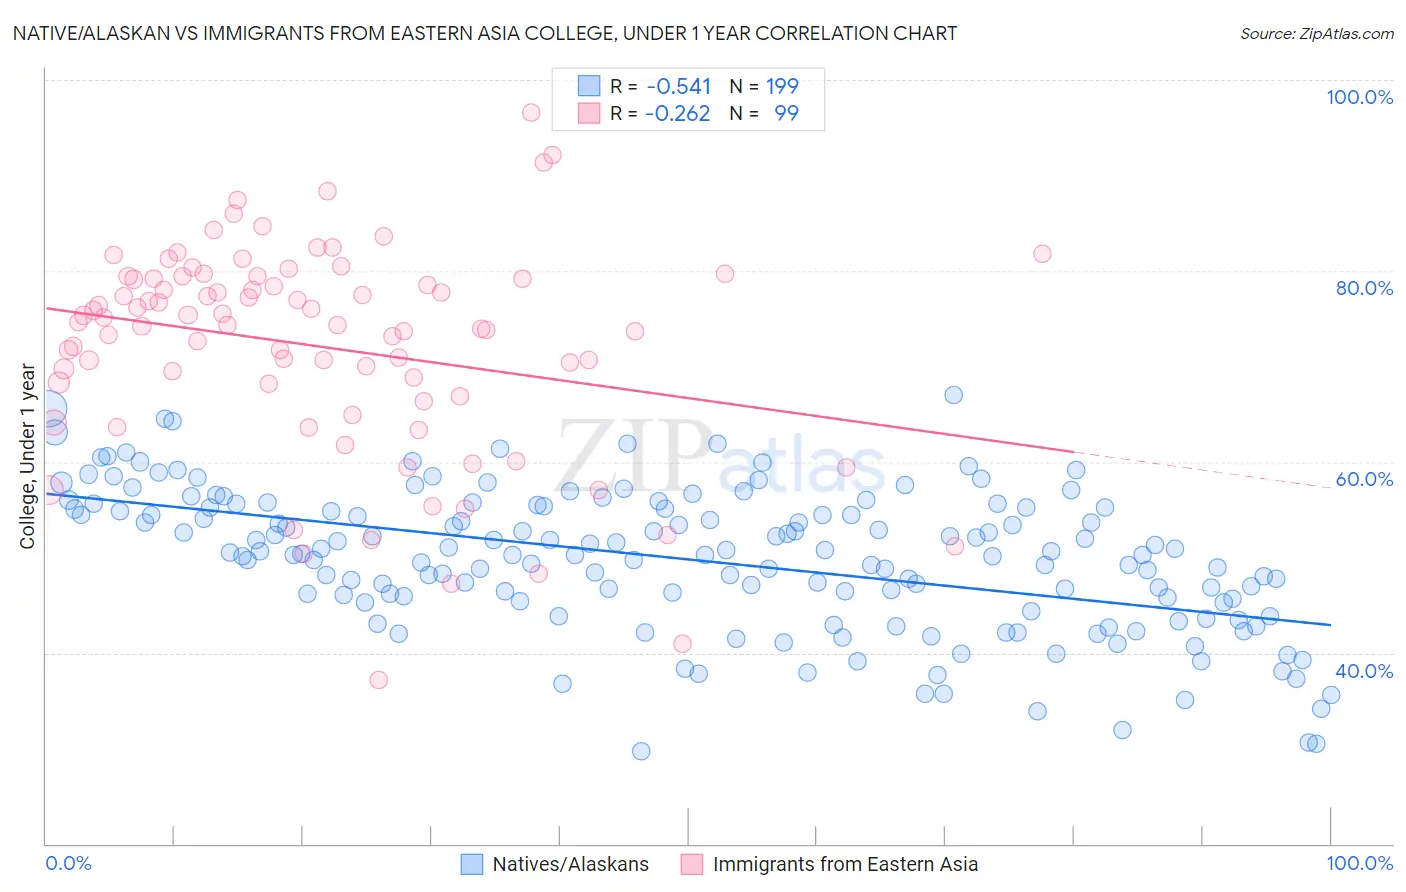
Native/Alaskan vs Immigrants from Eastern Asia College, Under 1 year Correlation Chart
The statistical analysis conducted on geographies consisting of 513,071,269 people shows a substantial negative correlation between the proportion of Natives/Alaskans and percentage of population with at least college, under 1 year education in the United States with a correlation coefficient (R) of -0.541 and weighted average of 56.6%. Similarly, the statistical analysis conducted on geographies consisting of 499,935,420 people shows a weak negative correlation between the proportion of Immigrants from Eastern Asia and percentage of population with at least college, under 1 year education in the United States with a correlation coefficient (R) of -0.262 and weighted average of 71.3%, a difference of 25.8%.
College, Under 1 year Correlation Summary
| Measurement | Native/Alaskan | Immigrants from Eastern Asia |
| Minimum | 29.7% | 37.2% |
| Maximum | 67.0% | 96.6% |
| Range | 37.4% | 59.5% |
| Mean | 49.8% | 72.1% |
| Median | 50.4% | 74.4% |
| Interquartile 25% (IQ1) | 45.4% | 66.9% |
| Interquartile 75% (IQ3) | 55.2% | 79.2% |
| Interquartile Range (IQR) | 9.8% | 12.4% |
| Standard Deviation (Sample) | 7.4% | 11.1% |
| Standard Deviation (Population) | 7.4% | 11.0% |
Similar Demographics by College, Under 1 year
Demographics Similar to Natives/Alaskans by College, Under 1 year
In terms of college, under 1 year, the demographic groups most similar to Natives/Alaskans are Immigrants from Caribbean (56.6%, a difference of 0.13%), Guatemalan (56.8%, a difference of 0.26%), Immigrants from Honduras (56.5%, a difference of 0.31%), Puerto Rican (56.8%, a difference of 0.32%), and Immigrants from El Salvador (56.4%, a difference of 0.44%).
| Demographics | Rating | Rank | College, Under 1 year |
| Hopi | 0.0 /100 | #314 | Tragic 57.1% |
| Hondurans | 0.0 /100 | #315 | Tragic 57.1% |
| Menominee | 0.0 /100 | #316 | Tragic 57.0% |
| Hispanics or Latinos | 0.0 /100 | #317 | Tragic 57.0% |
| Immigrants | Haiti | 0.0 /100 | #318 | Tragic 56.9% |
| Puerto Ricans | 0.0 /100 | #319 | Tragic 56.8% |
| Guatemalans | 0.0 /100 | #320 | Tragic 56.8% |
| Natives/Alaskans | 0.0 /100 | #321 | Tragic 56.6% |
| Immigrants | Caribbean | 0.0 /100 | #322 | Tragic 56.6% |
| Immigrants | Honduras | 0.0 /100 | #323 | Tragic 56.5% |
| Immigrants | El Salvador | 0.0 /100 | #324 | Tragic 56.4% |
| Immigrants | Latin America | 0.0 /100 | #325 | Tragic 56.3% |
| Navajo | 0.0 /100 | #326 | Tragic 56.3% |
| Immigrants | Guatemala | 0.0 /100 | #327 | Tragic 56.2% |
| Cape Verdeans | 0.0 /100 | #328 | Tragic 56.0% |
Demographics Similar to Immigrants from Eastern Asia by College, Under 1 year
In terms of college, under 1 year, the demographic groups most similar to Immigrants from Eastern Asia are Immigrants from Northern Europe (71.1%, a difference of 0.23%), Soviet Union (71.1%, a difference of 0.24%), Immigrants from Belgium (71.5%, a difference of 0.25%), Bulgarian (71.1%, a difference of 0.25%), and Immigrants from Denmark (71.0%, a difference of 0.37%).
| Demographics | Rating | Rank | College, Under 1 year |
| Burmese | 100.0 /100 | #15 | Exceptional 71.9% |
| Immigrants | Japan | 100.0 /100 | #16 | Exceptional 71.9% |
| Eastern Europeans | 100.0 /100 | #17 | Exceptional 71.8% |
| Immigrants | Switzerland | 100.0 /100 | #18 | Exceptional 71.7% |
| Latvians | 100.0 /100 | #19 | Exceptional 71.6% |
| Immigrants | Korea | 100.0 /100 | #20 | Exceptional 71.6% |
| Immigrants | Belgium | 100.0 /100 | #21 | Exceptional 71.5% |
| Immigrants | Eastern Asia | 100.0 /100 | #22 | Exceptional 71.3% |
| Immigrants | Northern Europe | 100.0 /100 | #23 | Exceptional 71.1% |
| Soviet Union | 100.0 /100 | #24 | Exceptional 71.1% |
| Bulgarians | 100.0 /100 | #25 | Exceptional 71.1% |
| Immigrants | Denmark | 100.0 /100 | #26 | Exceptional 71.0% |
| Immigrants | Ireland | 100.0 /100 | #27 | Exceptional 71.0% |
| Immigrants | Hong Kong | 100.0 /100 | #28 | Exceptional 71.0% |
| Immigrants | France | 100.0 /100 | #29 | Exceptional 71.0% |