Native/Alaskan vs Immigrants from Burma/Myanmar Unemployment Among Ages 25 to 29 years
COMPARE
Native/Alaskan
Immigrants from Burma/Myanmar
Unemployment Among Ages 25 to 29 years
Unemployment Among Ages 25 to 29 years Comparison
Natives/Alaskans
Immigrants from Burma/Myanmar
9.8%
UNEMPLOYMENT AMONG AGES 25 TO 29 YEARS
0.0/ 100
METRIC RATING
330th/ 347
METRIC RANK
6.2%
UNEMPLOYMENT AMONG AGES 25 TO 29 YEARS
98.7/ 100
METRIC RATING
56th/ 347
METRIC RANK
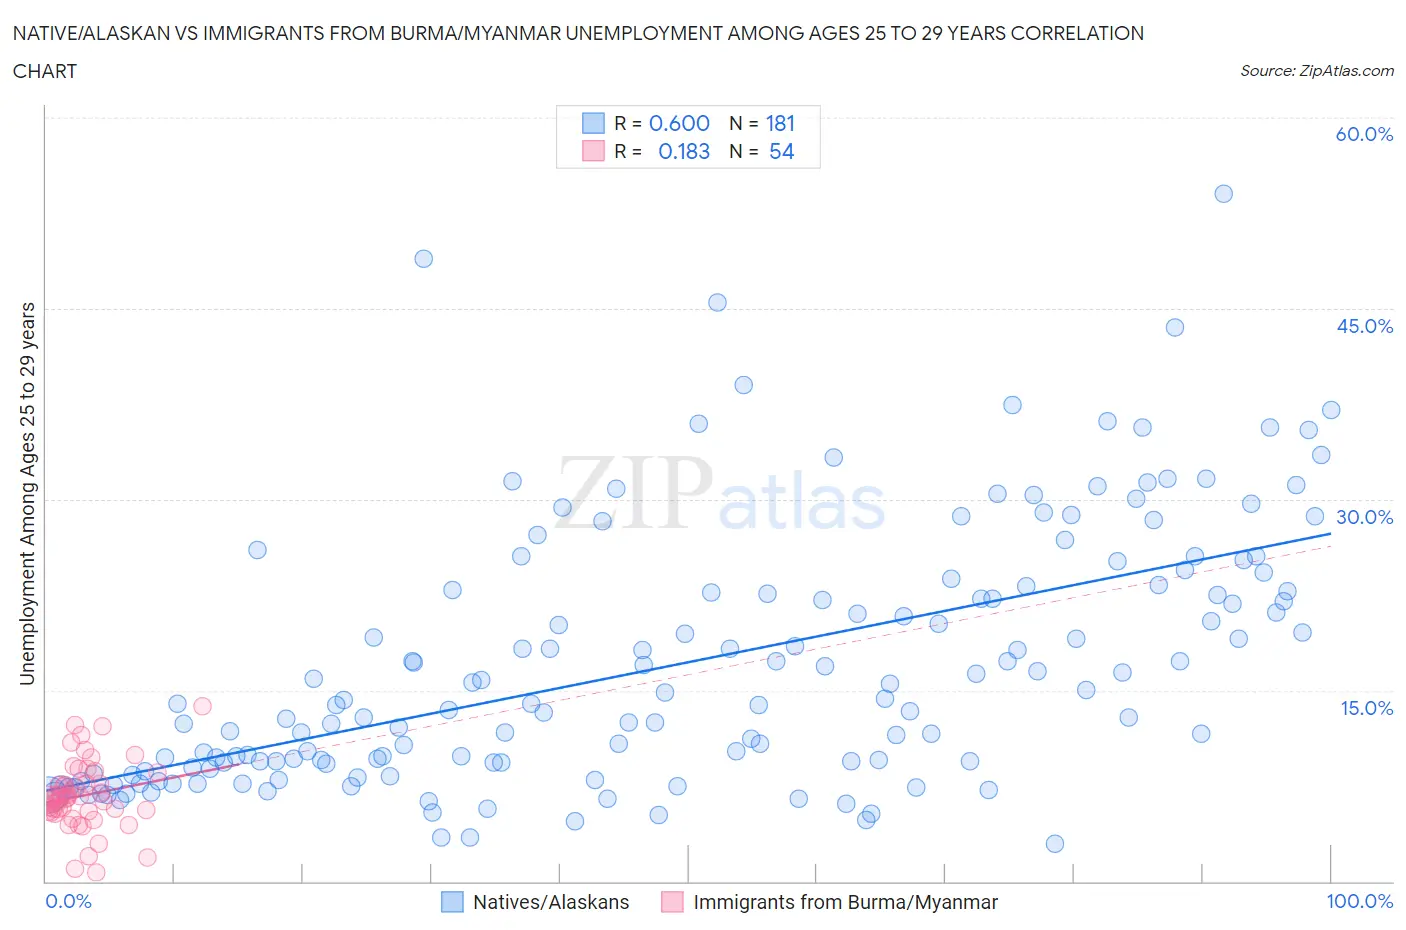
Native/Alaskan vs Immigrants from Burma/Myanmar Unemployment Among Ages 25 to 29 years Correlation Chart
The statistical analysis conducted on geographies consisting of 472,592,888 people shows a significant positive correlation between the proportion of Natives/Alaskans and unemployment rate among population between the ages 25 and 29 in the United States with a correlation coefficient (R) of 0.600 and weighted average of 9.8%. Similarly, the statistical analysis conducted on geographies consisting of 169,671,818 people shows a poor positive correlation between the proportion of Immigrants from Burma/Myanmar and unemployment rate among population between the ages 25 and 29 in the United States with a correlation coefficient (R) of 0.183 and weighted average of 6.2%, a difference of 58.3%.
Unemployment Among Ages 25 to 29 years Correlation Summary
| Measurement | Native/Alaskan | Immigrants from Burma/Myanmar |
| Minimum | 2.9% | 0.70% |
| Maximum | 54.0% | 13.7% |
| Range | 51.1% | 13.0% |
| Mean | 17.0% | 6.7% |
| Median | 14.0% | 6.5% |
| Interquartile 25% (IQ1) | 9.1% | 5.5% |
| Interquartile 75% (IQ3) | 23.0% | 7.7% |
| Interquartile Range (IQR) | 13.9% | 2.2% |
| Standard Deviation (Sample) | 10.1% | 2.7% |
| Standard Deviation (Population) | 10.1% | 2.6% |
Similar Demographics by Unemployment Among Ages 25 to 29 years
Demographics Similar to Natives/Alaskans by Unemployment Among Ages 25 to 29 years
In terms of unemployment among ages 25 to 29 years, the demographic groups most similar to Natives/Alaskans are Aleut (9.7%, a difference of 1.4%), Apache (9.5%, a difference of 3.6%), Alaska Native (10.2%, a difference of 3.7%), Pueblo (10.4%, a difference of 6.1%), and Colville (9.2%, a difference of 6.3%).
| Demographics | Rating | Rank | Unemployment Among Ages 25 to 29 years |
| Dominicans | 0.0 /100 | #323 | Tragic 8.7% |
| Houma | 0.0 /100 | #324 | Tragic 8.7% |
| Yakama | 0.0 /100 | #325 | Tragic 8.8% |
| Shoshone | 0.0 /100 | #326 | Tragic 9.2% |
| Colville | 0.0 /100 | #327 | Tragic 9.2% |
| Apache | 0.0 /100 | #328 | Tragic 9.5% |
| Aleuts | 0.0 /100 | #329 | Tragic 9.7% |
| Natives/Alaskans | 0.0 /100 | #330 | Tragic 9.8% |
| Alaska Natives | 0.0 /100 | #331 | Tragic 10.2% |
| Pueblo | 0.0 /100 | #332 | Tragic 10.4% |
| Alaskan Athabascans | 0.0 /100 | #333 | Tragic 10.8% |
| Yuman | 0.0 /100 | #334 | Tragic 11.0% |
| Puerto Ricans | 0.0 /100 | #335 | Tragic 11.1% |
| Lumbee | 0.0 /100 | #336 | Tragic 11.2% |
| Menominee | 0.0 /100 | #337 | Tragic 11.3% |
Demographics Similar to Immigrants from Burma/Myanmar by Unemployment Among Ages 25 to 29 years
In terms of unemployment among ages 25 to 29 years, the demographic groups most similar to Immigrants from Burma/Myanmar are Immigrants from Netherlands (6.2%, a difference of 0.020%), Immigrants from Saudi Arabia (6.2%, a difference of 0.090%), Swedish (6.2%, a difference of 0.20%), Turkish (6.2%, a difference of 0.22%), and Immigrants from Eastern Asia (6.2%, a difference of 0.25%).
| Demographics | Rating | Rank | Unemployment Among Ages 25 to 29 years |
| German Russians | 99.0 /100 | #49 | Exceptional 6.2% |
| Soviet Union | 98.9 /100 | #50 | Exceptional 6.2% |
| Burmese | 98.9 /100 | #51 | Exceptional 6.2% |
| Immigrants | Turkey | 98.9 /100 | #52 | Exceptional 6.2% |
| Turks | 98.8 /100 | #53 | Exceptional 6.2% |
| Swedes | 98.8 /100 | #54 | Exceptional 6.2% |
| Immigrants | Netherlands | 98.7 /100 | #55 | Exceptional 6.2% |
| Immigrants | Burma/Myanmar | 98.7 /100 | #56 | Exceptional 6.2% |
| Immigrants | Saudi Arabia | 98.6 /100 | #57 | Exceptional 6.2% |
| Immigrants | Eastern Asia | 98.4 /100 | #58 | Exceptional 6.2% |
| Luxembourgers | 98.3 /100 | #59 | Exceptional 6.2% |
| Immigrants | Taiwan | 98.3 /100 | #60 | Exceptional 6.2% |
| Bhutanese | 98.2 /100 | #61 | Exceptional 6.2% |
| Immigrants | China | 98.1 /100 | #62 | Exceptional 6.2% |
| Kenyans | 98.0 /100 | #63 | Exceptional 6.3% |