Native/Alaskan vs Swiss College, Under 1 year
COMPARE
Native/Alaskan
Swiss
College, Under 1 year
College, Under 1 year Comparison
Natives/Alaskans
Swiss
56.6%
COLLEGE, UNDER 1 YEAR
0.0/ 100
METRIC RATING
321st/ 347
METRIC RANK
65.5%
COLLEGE, UNDER 1 YEAR
53.9/ 100
METRIC RATING
173rd/ 347
METRIC RANK
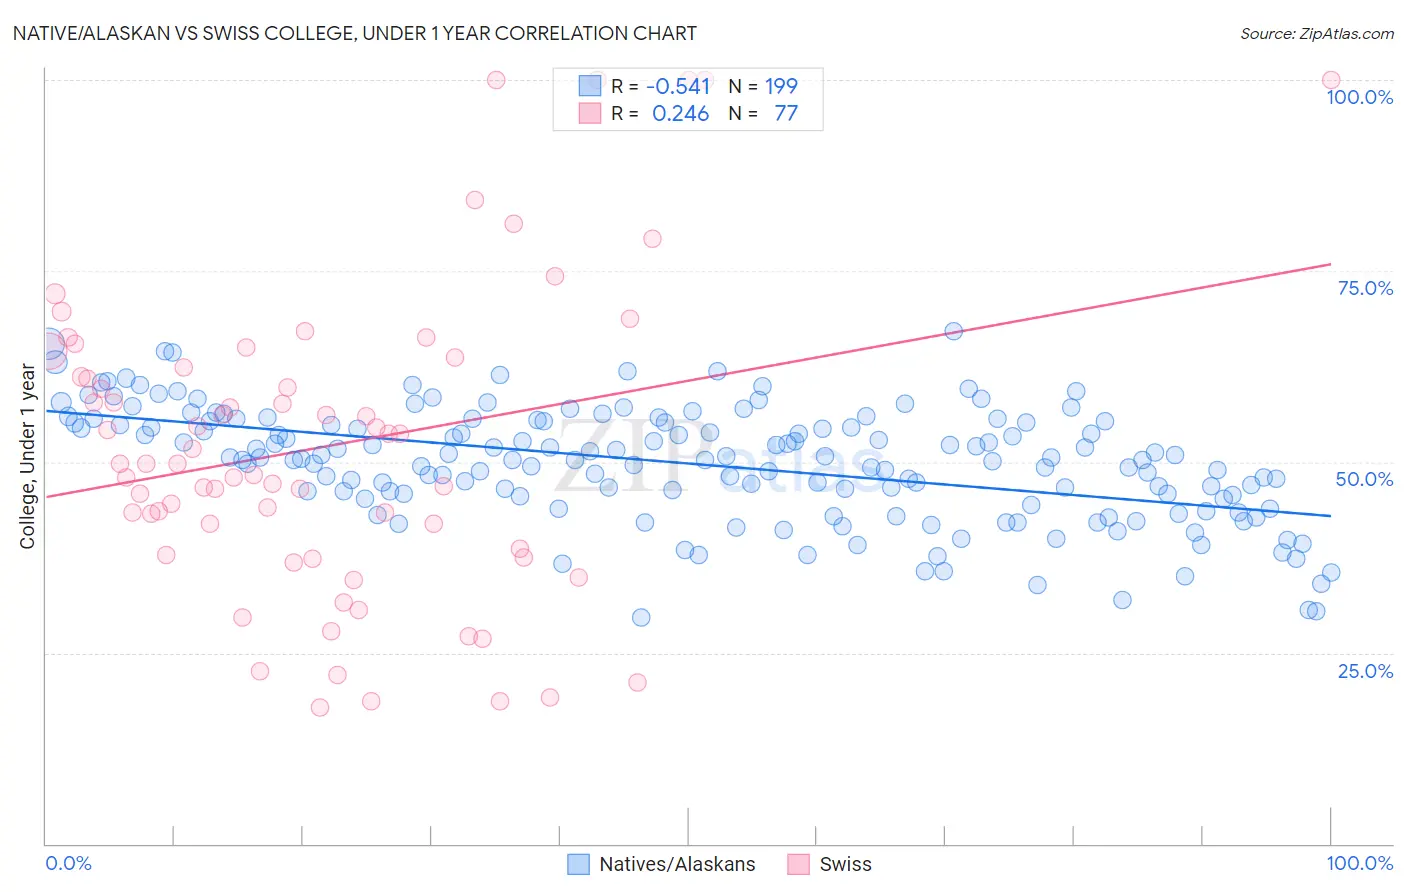
Native/Alaskan vs Swiss College, Under 1 year Correlation Chart
The statistical analysis conducted on geographies consisting of 513,071,269 people shows a substantial negative correlation between the proportion of Natives/Alaskans and percentage of population with at least college, under 1 year education in the United States with a correlation coefficient (R) of -0.541 and weighted average of 56.6%. Similarly, the statistical analysis conducted on geographies consisting of 465,017,987 people shows a weak positive correlation between the proportion of Swiss and percentage of population with at least college, under 1 year education in the United States with a correlation coefficient (R) of 0.246 and weighted average of 65.5%, a difference of 15.7%.
College, Under 1 year Correlation Summary
| Measurement | Native/Alaskan | Swiss |
| Minimum | 29.7% | 17.9% |
| Maximum | 67.0% | 100.0% |
| Range | 37.4% | 82.1% |
| Mean | 49.8% | 52.0% |
| Median | 50.4% | 49.7% |
| Interquartile 25% (IQ1) | 45.4% | 38.2% |
| Interquartile 75% (IQ3) | 55.2% | 63.0% |
| Interquartile Range (IQR) | 9.8% | 24.8% |
| Standard Deviation (Sample) | 7.4% | 20.0% |
| Standard Deviation (Population) | 7.4% | 19.9% |
Similar Demographics by College, Under 1 year
Demographics Similar to Natives/Alaskans by College, Under 1 year
In terms of college, under 1 year, the demographic groups most similar to Natives/Alaskans are Immigrants from Caribbean (56.6%, a difference of 0.13%), Guatemalan (56.8%, a difference of 0.26%), Immigrants from Honduras (56.5%, a difference of 0.31%), Puerto Rican (56.8%, a difference of 0.32%), and Immigrants from El Salvador (56.4%, a difference of 0.44%).
| Demographics | Rating | Rank | College, Under 1 year |
| Hopi | 0.0 /100 | #314 | Tragic 57.1% |
| Hondurans | 0.0 /100 | #315 | Tragic 57.1% |
| Menominee | 0.0 /100 | #316 | Tragic 57.0% |
| Hispanics or Latinos | 0.0 /100 | #317 | Tragic 57.0% |
| Immigrants | Haiti | 0.0 /100 | #318 | Tragic 56.9% |
| Puerto Ricans | 0.0 /100 | #319 | Tragic 56.8% |
| Guatemalans | 0.0 /100 | #320 | Tragic 56.8% |
| Natives/Alaskans | 0.0 /100 | #321 | Tragic 56.6% |
| Immigrants | Caribbean | 0.0 /100 | #322 | Tragic 56.6% |
| Immigrants | Honduras | 0.0 /100 | #323 | Tragic 56.5% |
| Immigrants | El Salvador | 0.0 /100 | #324 | Tragic 56.4% |
| Immigrants | Latin America | 0.0 /100 | #325 | Tragic 56.3% |
| Navajo | 0.0 /100 | #326 | Tragic 56.3% |
| Immigrants | Guatemala | 0.0 /100 | #327 | Tragic 56.2% |
| Cape Verdeans | 0.0 /100 | #328 | Tragic 56.0% |
Demographics Similar to Swiss by College, Under 1 year
In terms of college, under 1 year, the demographic groups most similar to Swiss are South American Indian (65.5%, a difference of 0.020%), Immigrants from Oceania (65.6%, a difference of 0.050%), Yugoslavian (65.6%, a difference of 0.080%), German (65.6%, a difference of 0.080%), and Hungarian (65.6%, a difference of 0.090%).
| Demographics | Rating | Rank | College, Under 1 year |
| Moroccans | 56.7 /100 | #166 | Average 65.6% |
| Immigrants | Somalia | 56.4 /100 | #167 | Average 65.6% |
| Hungarians | 55.9 /100 | #168 | Average 65.6% |
| Yugoslavians | 55.7 /100 | #169 | Average 65.6% |
| Germans | 55.7 /100 | #170 | Average 65.6% |
| Immigrants | Oceania | 55.0 /100 | #171 | Average 65.6% |
| South American Indians | 54.4 /100 | #172 | Average 65.5% |
| Swiss | 53.9 /100 | #173 | Average 65.5% |
| Immigrants | Bosnia and Herzegovina | 50.0 /100 | #174 | Average 65.4% |
| Scotch-Irish | 49.5 /100 | #175 | Average 65.4% |
| French | 48.9 /100 | #176 | Average 65.4% |
| Immigrants | North Macedonia | 48.6 /100 | #177 | Average 65.4% |
| German Russians | 48.3 /100 | #178 | Average 65.4% |
| Guamanians/Chamorros | 48.2 /100 | #179 | Average 65.4% |
| Dutch | 46.1 /100 | #180 | Average 65.3% |