Moroccan vs Chilean No Schooling Completed
COMPARE
Moroccan
Chilean
No Schooling Completed
No Schooling Completed Comparison
Moroccans
Chileans
2.2%
NO SCHOOLING COMPLETED
13.7/ 100
METRIC RATING
202nd/ 347
METRIC RANK
2.0%
NO SCHOOLING COMPLETED
67.2/ 100
METRIC RATING
156th/ 347
METRIC RANK
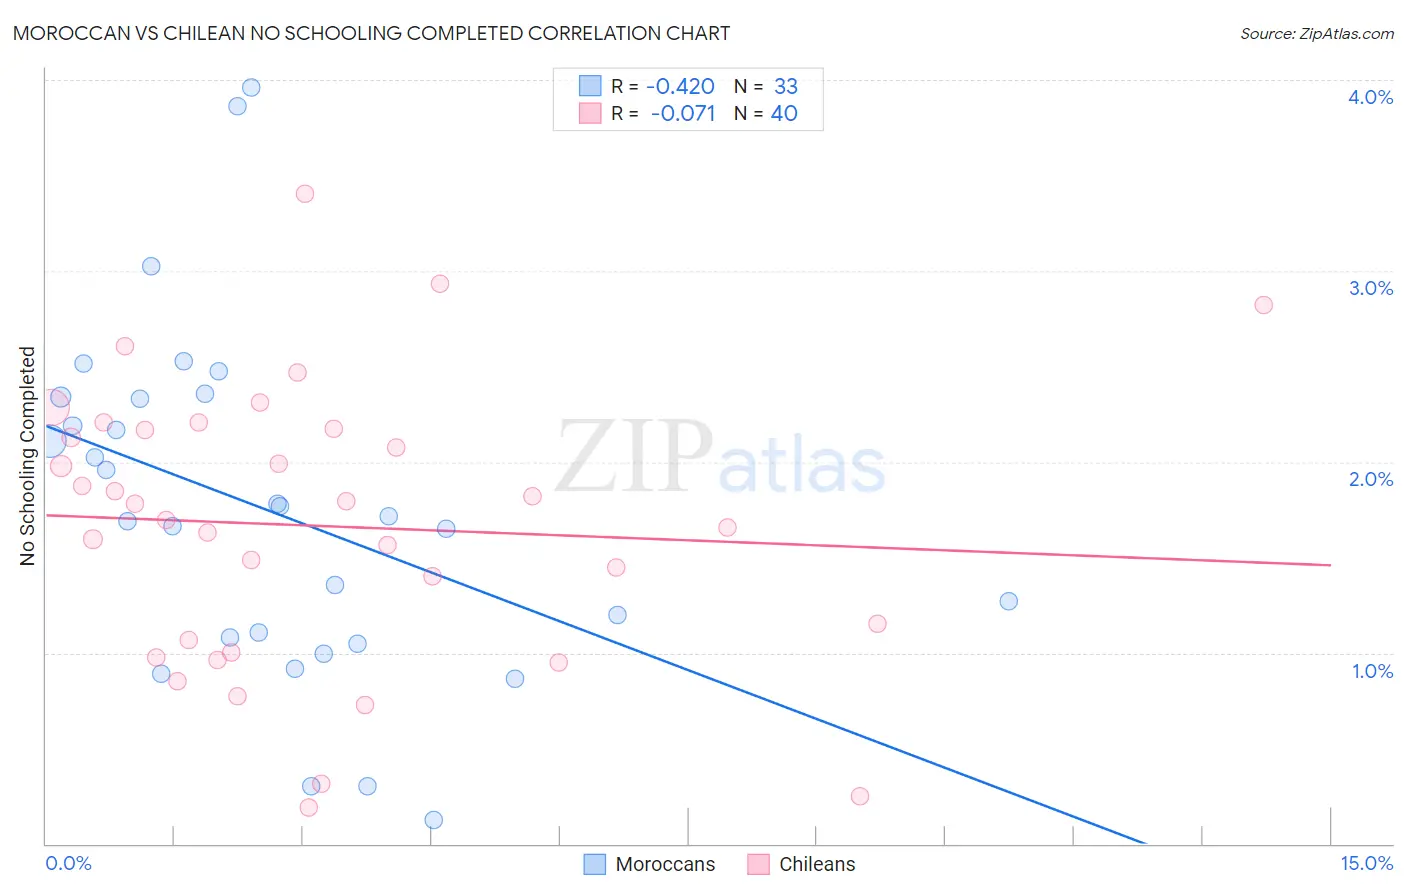
Moroccan vs Chilean No Schooling Completed Correlation Chart
The statistical analysis conducted on geographies consisting of 201,160,472 people shows a moderate negative correlation between the proportion of Moroccans and percentage of population with no schooling in the United States with a correlation coefficient (R) of -0.420 and weighted average of 2.2%. Similarly, the statistical analysis conducted on geographies consisting of 255,430,535 people shows a slight negative correlation between the proportion of Chileans and percentage of population with no schooling in the United States with a correlation coefficient (R) of -0.071 and weighted average of 2.0%, a difference of 8.8%.
No Schooling Completed Correlation Summary
| Measurement | Moroccan | Chilean |
| Minimum | 0.12% | 0.19% |
| Maximum | 4.0% | 3.4% |
| Range | 3.8% | 3.2% |
| Mean | 1.7% | 1.7% |
| Median | 1.7% | 1.7% |
| Interquartile 25% (IQ1) | 1.1% | 1.0% |
| Interquartile 75% (IQ3) | 2.3% | 2.2% |
| Interquartile Range (IQR) | 1.3% | 1.1% |
| Standard Deviation (Sample) | 0.90% | 0.74% |
| Standard Deviation (Population) | 0.89% | 0.73% |
Similar Demographics by No Schooling Completed
Demographics Similar to Moroccans by No Schooling Completed
In terms of no schooling completed, the demographic groups most similar to Moroccans are Laotian (2.2%, a difference of 0.11%), Hopi (2.2%, a difference of 0.22%), Immigrants from Bahamas (2.2%, a difference of 0.62%), Bahamian (2.2%, a difference of 0.63%), and South American Indian (2.2%, a difference of 0.81%).
| Demographics | Rating | Rank | No Schooling Completed |
| Hawaiians | 27.0 /100 | #195 | Fair 2.2% |
| Immigrants | Ukraine | 26.1 /100 | #196 | Fair 2.2% |
| Immigrants | Southern Europe | 23.8 /100 | #197 | Fair 2.2% |
| Immigrants | Chile | 22.7 /100 | #198 | Fair 2.2% |
| Africans | 21.8 /100 | #199 | Fair 2.2% |
| Immigrants | Northern Africa | 19.5 /100 | #200 | Poor 2.2% |
| Costa Ricans | 17.1 /100 | #201 | Poor 2.2% |
| Moroccans | 13.7 /100 | #202 | Poor 2.2% |
| Laotians | 13.3 /100 | #203 | Poor 2.2% |
| Hopi | 12.9 /100 | #204 | Poor 2.2% |
| Immigrants | Bahamas | 11.6 /100 | #205 | Poor 2.2% |
| Bahamians | 11.6 /100 | #206 | Poor 2.2% |
| South American Indians | 11.0 /100 | #207 | Poor 2.2% |
| Uruguayans | 11.0 /100 | #208 | Poor 2.2% |
| Immigrants | Oceania | 10.2 /100 | #209 | Poor 2.2% |
Demographics Similar to Chileans by No Schooling Completed
In terms of no schooling completed, the demographic groups most similar to Chileans are Immigrants from Sri Lanka (2.0%, a difference of 0.030%), Immigrants from Russia (2.0%, a difference of 0.070%), Immigrants from Korea (2.0%, a difference of 0.080%), Immigrants from Spain (2.0%, a difference of 0.12%), and Immigrants from Venezuela (2.0%, a difference of 0.21%).
| Demographics | Rating | Rank | No Schooling Completed |
| Immigrants | North Macedonia | 75.9 /100 | #149 | Good 2.0% |
| Blackfeet | 72.9 /100 | #150 | Good 2.0% |
| Immigrants | Jordan | 70.9 /100 | #151 | Good 2.0% |
| Immigrants | Eastern Europe | 70.4 /100 | #152 | Good 2.0% |
| Immigrants | Italy | 68.9 /100 | #153 | Good 2.0% |
| Immigrants | Venezuela | 68.5 /100 | #154 | Good 2.0% |
| Immigrants | Russia | 67.6 /100 | #155 | Good 2.0% |
| Chileans | 67.2 /100 | #156 | Good 2.0% |
| Immigrants | Sri Lanka | 67.0 /100 | #157 | Good 2.0% |
| Immigrants | Korea | 66.7 /100 | #158 | Good 2.0% |
| Immigrants | Spain | 66.4 /100 | #159 | Good 2.0% |
| Kenyans | 65.7 /100 | #160 | Good 2.0% |
| Ugandans | 64.6 /100 | #161 | Good 2.0% |
| Immigrants | Brazil | 63.8 /100 | #162 | Good 2.1% |
| Albanians | 62.2 /100 | #163 | Good 2.1% |