Moroccan vs Immigrants from Croatia No Schooling Completed
COMPARE
Moroccan
Immigrants from Croatia
No Schooling Completed
No Schooling Completed Comparison
Moroccans
Immigrants from Croatia
2.2%
NO SCHOOLING COMPLETED
13.7/ 100
METRIC RATING
202nd/ 347
METRIC RANK
1.9%
NO SCHOOLING COMPLETED
94.5/ 100
METRIC RATING
121st/ 347
METRIC RANK
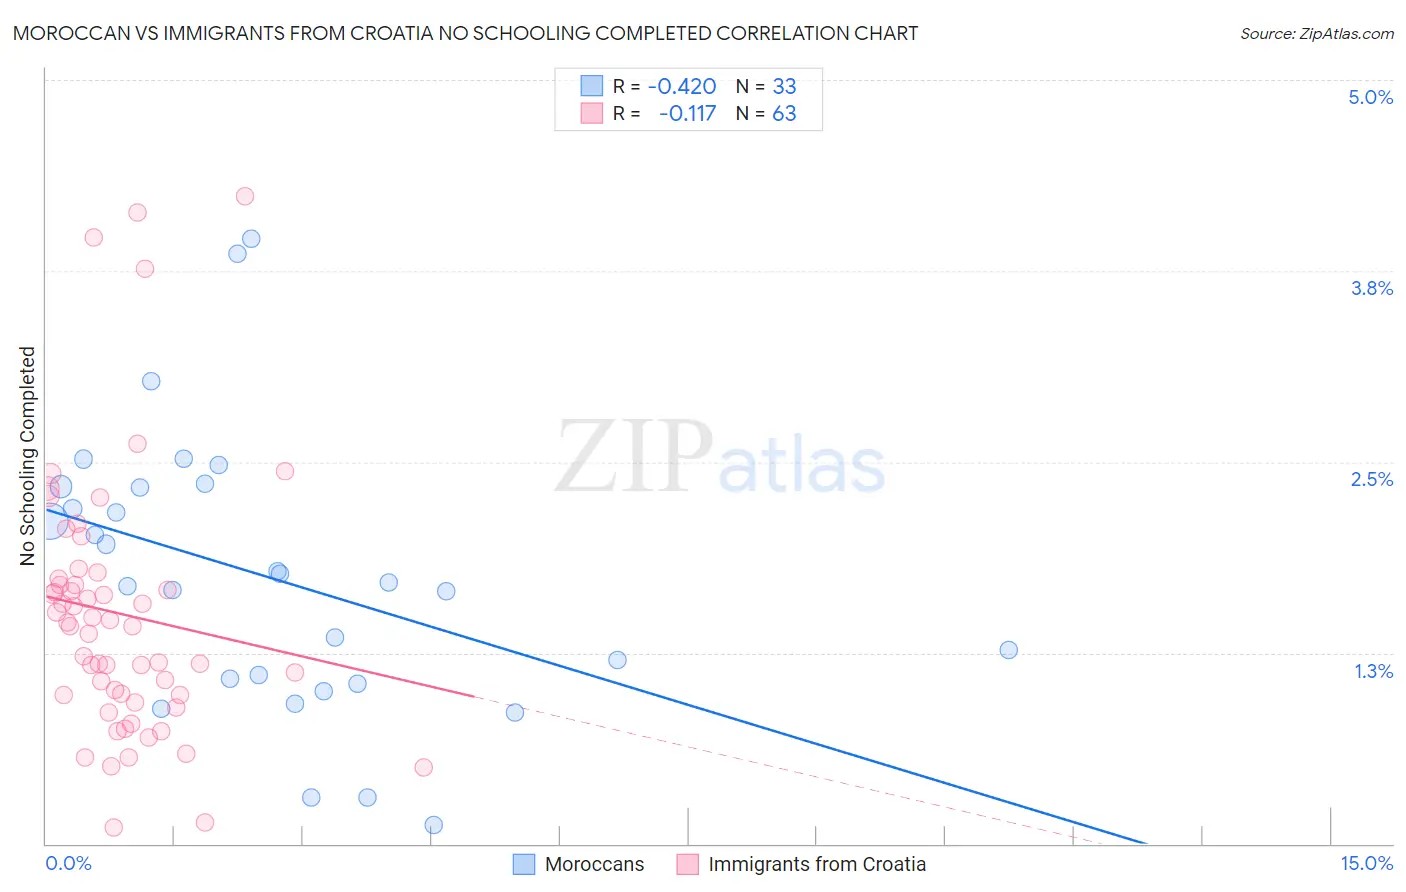
Moroccan vs Immigrants from Croatia No Schooling Completed Correlation Chart
The statistical analysis conducted on geographies consisting of 201,160,472 people shows a moderate negative correlation between the proportion of Moroccans and percentage of population with no schooling in the United States with a correlation coefficient (R) of -0.420 and weighted average of 2.2%. Similarly, the statistical analysis conducted on geographies consisting of 132,073,413 people shows a poor negative correlation between the proportion of Immigrants from Croatia and percentage of population with no schooling in the United States with a correlation coefficient (R) of -0.117 and weighted average of 1.9%, a difference of 17.4%.
No Schooling Completed Correlation Summary
| Measurement | Moroccan | Immigrants from Croatia |
| Minimum | 0.12% | 0.11% |
| Maximum | 4.0% | 4.2% |
| Range | 3.8% | 4.1% |
| Mean | 1.7% | 1.5% |
| Median | 1.7% | 1.4% |
| Interquartile 25% (IQ1) | 1.1% | 0.97% |
| Interquartile 75% (IQ3) | 2.3% | 1.7% |
| Interquartile Range (IQR) | 1.3% | 0.77% |
| Standard Deviation (Sample) | 0.90% | 0.87% |
| Standard Deviation (Population) | 0.89% | 0.86% |
Similar Demographics by No Schooling Completed
Demographics Similar to Moroccans by No Schooling Completed
In terms of no schooling completed, the demographic groups most similar to Moroccans are Laotian (2.2%, a difference of 0.11%), Hopi (2.2%, a difference of 0.22%), Immigrants from Bahamas (2.2%, a difference of 0.62%), Bahamian (2.2%, a difference of 0.63%), and South American Indian (2.2%, a difference of 0.81%).
| Demographics | Rating | Rank | No Schooling Completed |
| Hawaiians | 27.0 /100 | #195 | Fair 2.2% |
| Immigrants | Ukraine | 26.1 /100 | #196 | Fair 2.2% |
| Immigrants | Southern Europe | 23.8 /100 | #197 | Fair 2.2% |
| Immigrants | Chile | 22.7 /100 | #198 | Fair 2.2% |
| Africans | 21.8 /100 | #199 | Fair 2.2% |
| Immigrants | Northern Africa | 19.5 /100 | #200 | Poor 2.2% |
| Costa Ricans | 17.1 /100 | #201 | Poor 2.2% |
| Moroccans | 13.7 /100 | #202 | Poor 2.2% |
| Laotians | 13.3 /100 | #203 | Poor 2.2% |
| Hopi | 12.9 /100 | #204 | Poor 2.2% |
| Immigrants | Bahamas | 11.6 /100 | #205 | Poor 2.2% |
| Bahamians | 11.6 /100 | #206 | Poor 2.2% |
| South American Indians | 11.0 /100 | #207 | Poor 2.2% |
| Uruguayans | 11.0 /100 | #208 | Poor 2.2% |
| Immigrants | Oceania | 10.2 /100 | #209 | Poor 2.2% |
Demographics Similar to Immigrants from Croatia by No Schooling Completed
In terms of no schooling completed, the demographic groups most similar to Immigrants from Croatia are Cree (1.9%, a difference of 0.030%), Immigrants from Bulgaria (1.9%, a difference of 0.060%), Immigrants from Kuwait (1.9%, a difference of 0.39%), Iroquois (1.9%, a difference of 0.47%), and Cambodian (1.9%, a difference of 0.47%).
| Demographics | Rating | Rank | No Schooling Completed |
| Immigrants | Norway | 96.1 /100 | #114 | Exceptional 1.9% |
| Syrians | 96.0 /100 | #115 | Exceptional 1.9% |
| Lebanese | 96.0 /100 | #116 | Exceptional 1.9% |
| Immigrants | Serbia | 95.8 /100 | #117 | Exceptional 1.9% |
| Spanish | 95.5 /100 | #118 | Exceptional 1.9% |
| Iroquois | 95.1 /100 | #119 | Exceptional 1.9% |
| Immigrants | Bulgaria | 94.6 /100 | #120 | Exceptional 1.9% |
| Immigrants | Croatia | 94.5 /100 | #121 | Exceptional 1.9% |
| Cree | 94.5 /100 | #122 | Exceptional 1.9% |
| Immigrants | Kuwait | 93.9 /100 | #123 | Exceptional 1.9% |
| Cambodians | 93.8 /100 | #124 | Exceptional 1.9% |
| Immigrants | Europe | 93.7 /100 | #125 | Exceptional 1.9% |
| Immigrants | Romania | 92.6 /100 | #126 | Exceptional 1.9% |
| Israelis | 92.4 /100 | #127 | Exceptional 1.9% |
| Spaniards | 92.3 /100 | #128 | Exceptional 1.9% |