Moroccan vs Immigrants from the Azores No Schooling Completed
COMPARE
Moroccan
Immigrants from the Azores
No Schooling Completed
No Schooling Completed Comparison
Moroccans
Immigrants from the Azores
2.2%
NO SCHOOLING COMPLETED
13.7/ 100
METRIC RATING
202nd/ 347
METRIC RANK
3.0%
NO SCHOOLING COMPLETED
0.0/ 100
METRIC RATING
311th/ 347
METRIC RANK
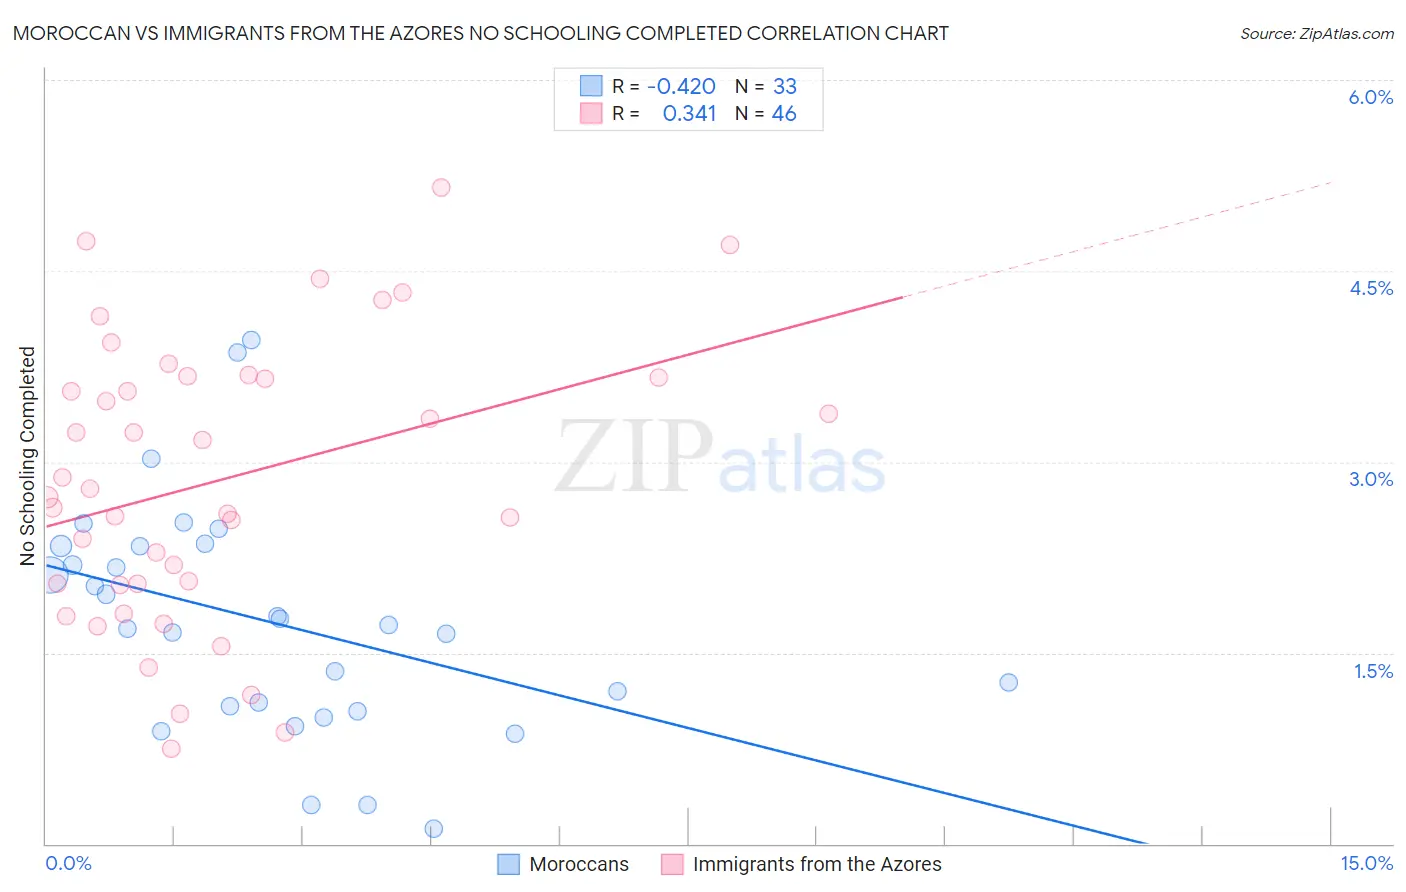
Moroccan vs Immigrants from the Azores No Schooling Completed Correlation Chart
The statistical analysis conducted on geographies consisting of 201,160,472 people shows a moderate negative correlation between the proportion of Moroccans and percentage of population with no schooling in the United States with a correlation coefficient (R) of -0.420 and weighted average of 2.2%. Similarly, the statistical analysis conducted on geographies consisting of 46,184,516 people shows a mild positive correlation between the proportion of Immigrants from the Azores and percentage of population with no schooling in the United States with a correlation coefficient (R) of 0.341 and weighted average of 3.0%, a difference of 36.9%.
No Schooling Completed Correlation Summary
| Measurement | Moroccan | Immigrants from the Azores |
| Minimum | 0.12% | 0.75% |
| Maximum | 4.0% | 5.2% |
| Range | 3.8% | 4.4% |
| Mean | 1.7% | 2.9% |
| Median | 1.7% | 2.8% |
| Interquartile 25% (IQ1) | 1.1% | 2.0% |
| Interquartile 75% (IQ3) | 2.3% | 3.7% |
| Interquartile Range (IQR) | 1.3% | 1.6% |
| Standard Deviation (Sample) | 0.90% | 1.1% |
| Standard Deviation (Population) | 0.89% | 1.1% |
Similar Demographics by No Schooling Completed
Demographics Similar to Moroccans by No Schooling Completed
In terms of no schooling completed, the demographic groups most similar to Moroccans are Laotian (2.2%, a difference of 0.11%), Hopi (2.2%, a difference of 0.22%), Immigrants from Bahamas (2.2%, a difference of 0.62%), Bahamian (2.2%, a difference of 0.63%), and South American Indian (2.2%, a difference of 0.81%).
| Demographics | Rating | Rank | No Schooling Completed |
| Hawaiians | 27.0 /100 | #195 | Fair 2.2% |
| Immigrants | Ukraine | 26.1 /100 | #196 | Fair 2.2% |
| Immigrants | Southern Europe | 23.8 /100 | #197 | Fair 2.2% |
| Immigrants | Chile | 22.7 /100 | #198 | Fair 2.2% |
| Africans | 21.8 /100 | #199 | Fair 2.2% |
| Immigrants | Northern Africa | 19.5 /100 | #200 | Poor 2.2% |
| Costa Ricans | 17.1 /100 | #201 | Poor 2.2% |
| Moroccans | 13.7 /100 | #202 | Poor 2.2% |
| Laotians | 13.3 /100 | #203 | Poor 2.2% |
| Hopi | 12.9 /100 | #204 | Poor 2.2% |
| Immigrants | Bahamas | 11.6 /100 | #205 | Poor 2.2% |
| Bahamians | 11.6 /100 | #206 | Poor 2.2% |
| South American Indians | 11.0 /100 | #207 | Poor 2.2% |
| Uruguayans | 11.0 /100 | #208 | Poor 2.2% |
| Immigrants | Oceania | 10.2 /100 | #209 | Poor 2.2% |
Demographics Similar to Immigrants from the Azores by No Schooling Completed
In terms of no schooling completed, the demographic groups most similar to Immigrants from the Azores are Guyanese (3.0%, a difference of 0.10%), Hispanic or Latino (3.0%, a difference of 0.15%), Sri Lankan (3.0%, a difference of 0.28%), Honduran (3.1%, a difference of 0.79%), and Immigrants from Belize (3.1%, a difference of 0.88%).
| Demographics | Rating | Rank | No Schooling Completed |
| Nicaraguans | 0.0 /100 | #304 | Tragic 2.9% |
| Ecuadorians | 0.0 /100 | #305 | Tragic 3.0% |
| Belizeans | 0.0 /100 | #306 | Tragic 3.0% |
| Immigrants | Haiti | 0.0 /100 | #307 | Tragic 3.0% |
| Immigrants | Somalia | 0.0 /100 | #308 | Tragic 3.0% |
| Hispanics or Latinos | 0.0 /100 | #309 | Tragic 3.0% |
| Guyanese | 0.0 /100 | #310 | Tragic 3.0% |
| Immigrants | Azores | 0.0 /100 | #311 | Tragic 3.0% |
| Sri Lankans | 0.0 /100 | #312 | Tragic 3.0% |
| Hondurans | 0.0 /100 | #313 | Tragic 3.1% |
| Immigrants | Belize | 0.0 /100 | #314 | Tragic 3.1% |
| Immigrants | Nicaragua | 0.0 /100 | #315 | Tragic 3.1% |
| Immigrants | Ecuador | 0.0 /100 | #316 | Tragic 3.1% |
| Cape Verdeans | 0.0 /100 | #317 | Tragic 3.1% |
| Immigrants | Guyana | 0.0 /100 | #318 | Tragic 3.1% |