Moroccan vs Immigrants from Dominica No Schooling Completed
COMPARE
Moroccan
Immigrants from Dominica
No Schooling Completed
No Schooling Completed Comparison
Moroccans
Immigrants from Dominica
2.2%
NO SCHOOLING COMPLETED
13.7/ 100
METRIC RATING
202nd/ 347
METRIC RANK
2.8%
NO SCHOOLING COMPLETED
0.0/ 100
METRIC RATING
298th/ 347
METRIC RANK
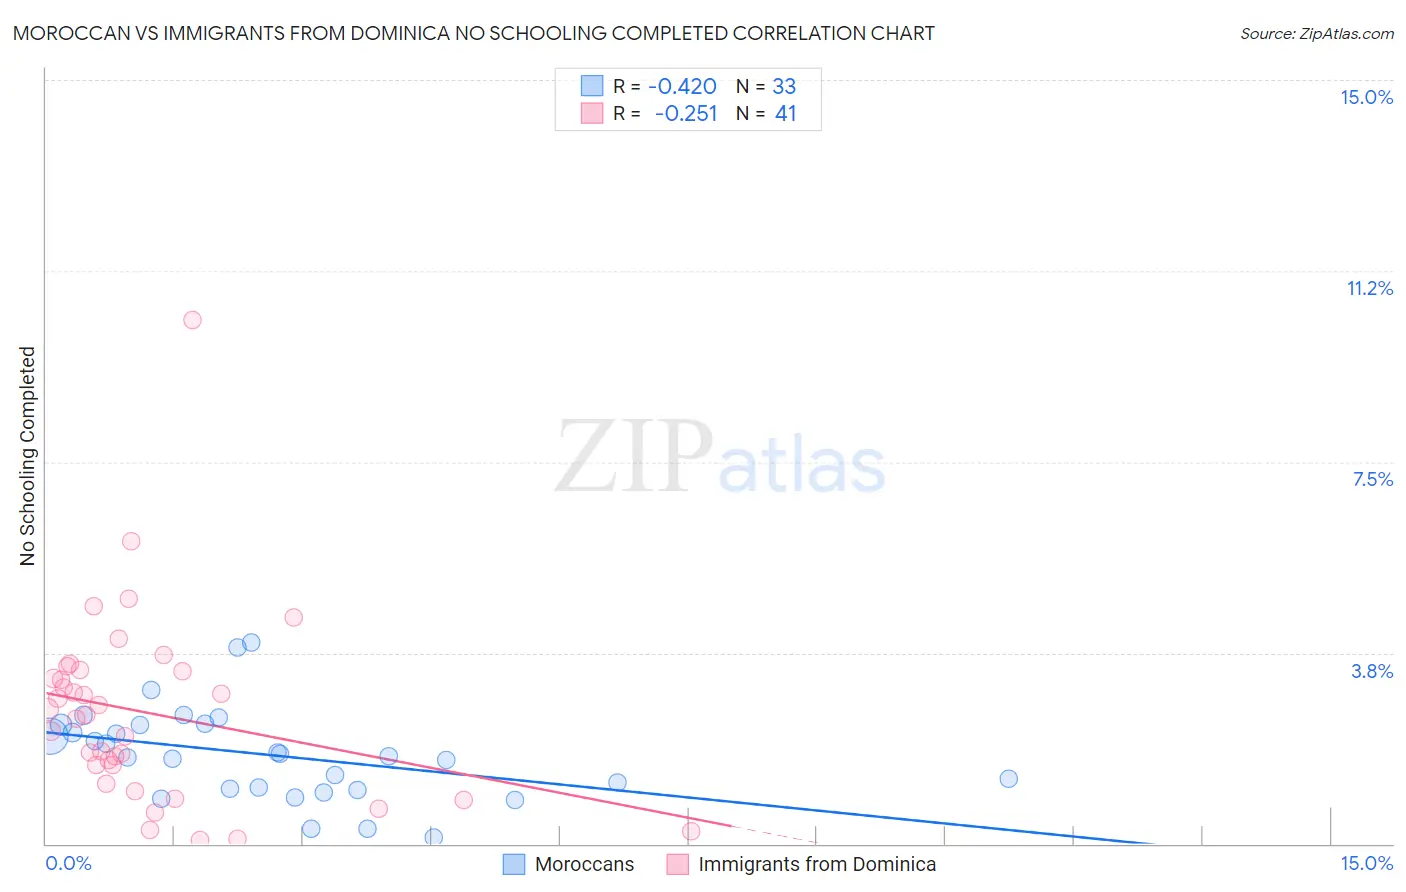
Moroccan vs Immigrants from Dominica No Schooling Completed Correlation Chart
The statistical analysis conducted on geographies consisting of 201,160,472 people shows a moderate negative correlation between the proportion of Moroccans and percentage of population with no schooling in the United States with a correlation coefficient (R) of -0.420 and weighted average of 2.2%. Similarly, the statistical analysis conducted on geographies consisting of 83,717,936 people shows a weak negative correlation between the proportion of Immigrants from Dominica and percentage of population with no schooling in the United States with a correlation coefficient (R) of -0.251 and weighted average of 2.8%, a difference of 27.5%.
No Schooling Completed Correlation Summary
| Measurement | Moroccan | Immigrants from Dominica |
| Minimum | 0.12% | 0.065% |
| Maximum | 4.0% | 10.3% |
| Range | 3.8% | 10.2% |
| Mean | 1.7% | 2.6% |
| Median | 1.7% | 2.5% |
| Interquartile 25% (IQ1) | 1.1% | 1.4% |
| Interquartile 75% (IQ3) | 2.3% | 3.4% |
| Interquartile Range (IQR) | 1.3% | 2.0% |
| Standard Deviation (Sample) | 0.90% | 1.9% |
| Standard Deviation (Population) | 0.89% | 1.8% |
Similar Demographics by No Schooling Completed
Demographics Similar to Moroccans by No Schooling Completed
In terms of no schooling completed, the demographic groups most similar to Moroccans are Laotian (2.2%, a difference of 0.11%), Hopi (2.2%, a difference of 0.22%), Immigrants from Bahamas (2.2%, a difference of 0.62%), Bahamian (2.2%, a difference of 0.63%), and South American Indian (2.2%, a difference of 0.81%).
| Demographics | Rating | Rank | No Schooling Completed |
| Hawaiians | 27.0 /100 | #195 | Fair 2.2% |
| Immigrants | Ukraine | 26.1 /100 | #196 | Fair 2.2% |
| Immigrants | Southern Europe | 23.8 /100 | #197 | Fair 2.2% |
| Immigrants | Chile | 22.7 /100 | #198 | Fair 2.2% |
| Africans | 21.8 /100 | #199 | Fair 2.2% |
| Immigrants | Northern Africa | 19.5 /100 | #200 | Poor 2.2% |
| Costa Ricans | 17.1 /100 | #201 | Poor 2.2% |
| Moroccans | 13.7 /100 | #202 | Poor 2.2% |
| Laotians | 13.3 /100 | #203 | Poor 2.2% |
| Hopi | 12.9 /100 | #204 | Poor 2.2% |
| Immigrants | Bahamas | 11.6 /100 | #205 | Poor 2.2% |
| Bahamians | 11.6 /100 | #206 | Poor 2.2% |
| South American Indians | 11.0 /100 | #207 | Poor 2.2% |
| Uruguayans | 11.0 /100 | #208 | Poor 2.2% |
| Immigrants | Oceania | 10.2 /100 | #209 | Poor 2.2% |
Demographics Similar to Immigrants from Dominica by No Schooling Completed
In terms of no schooling completed, the demographic groups most similar to Immigrants from Dominica are Immigrants from Cuba (2.8%, a difference of 0.33%), Central American Indian (2.8%, a difference of 0.51%), Haitian (2.9%, a difference of 0.83%), Immigrants (2.8%, a difference of 1.5%), and Houma (2.8%, a difference of 1.6%).
| Demographics | Rating | Rank | No Schooling Completed |
| British West Indians | 0.0 /100 | #291 | Tragic 2.7% |
| Immigrants | Grenada | 0.0 /100 | #292 | Tragic 2.8% |
| Malaysians | 0.0 /100 | #293 | Tragic 2.8% |
| Immigrants | Eritrea | 0.0 /100 | #294 | Tragic 2.8% |
| Houma | 0.0 /100 | #295 | Tragic 2.8% |
| Immigrants | Immigrants | 0.0 /100 | #296 | Tragic 2.8% |
| Immigrants | Cuba | 0.0 /100 | #297 | Tragic 2.8% |
| Immigrants | Dominica | 0.0 /100 | #298 | Tragic 2.8% |
| Central American Indians | 0.0 /100 | #299 | Tragic 2.8% |
| Haitians | 0.0 /100 | #300 | Tragic 2.9% |
| Immigrants | South Eastern Asia | 0.0 /100 | #301 | Tragic 2.9% |
| Immigrants | Caribbean | 0.0 /100 | #302 | Tragic 2.9% |
| Somalis | 0.0 /100 | #303 | Tragic 2.9% |
| Nicaraguans | 0.0 /100 | #304 | Tragic 2.9% |
| Ecuadorians | 0.0 /100 | #305 | Tragic 3.0% |