Moroccan vs Cherokee Doctorate Degree
COMPARE
Moroccan
Cherokee
Doctorate Degree
Doctorate Degree Comparison
Moroccans
Cherokee
2.0%
DOCTORATE DEGREE
93.0/ 100
METRIC RATING
125th/ 347
METRIC RANK
1.5%
DOCTORATE DEGREE
0.3/ 100
METRIC RATING
286th/ 347
METRIC RANK
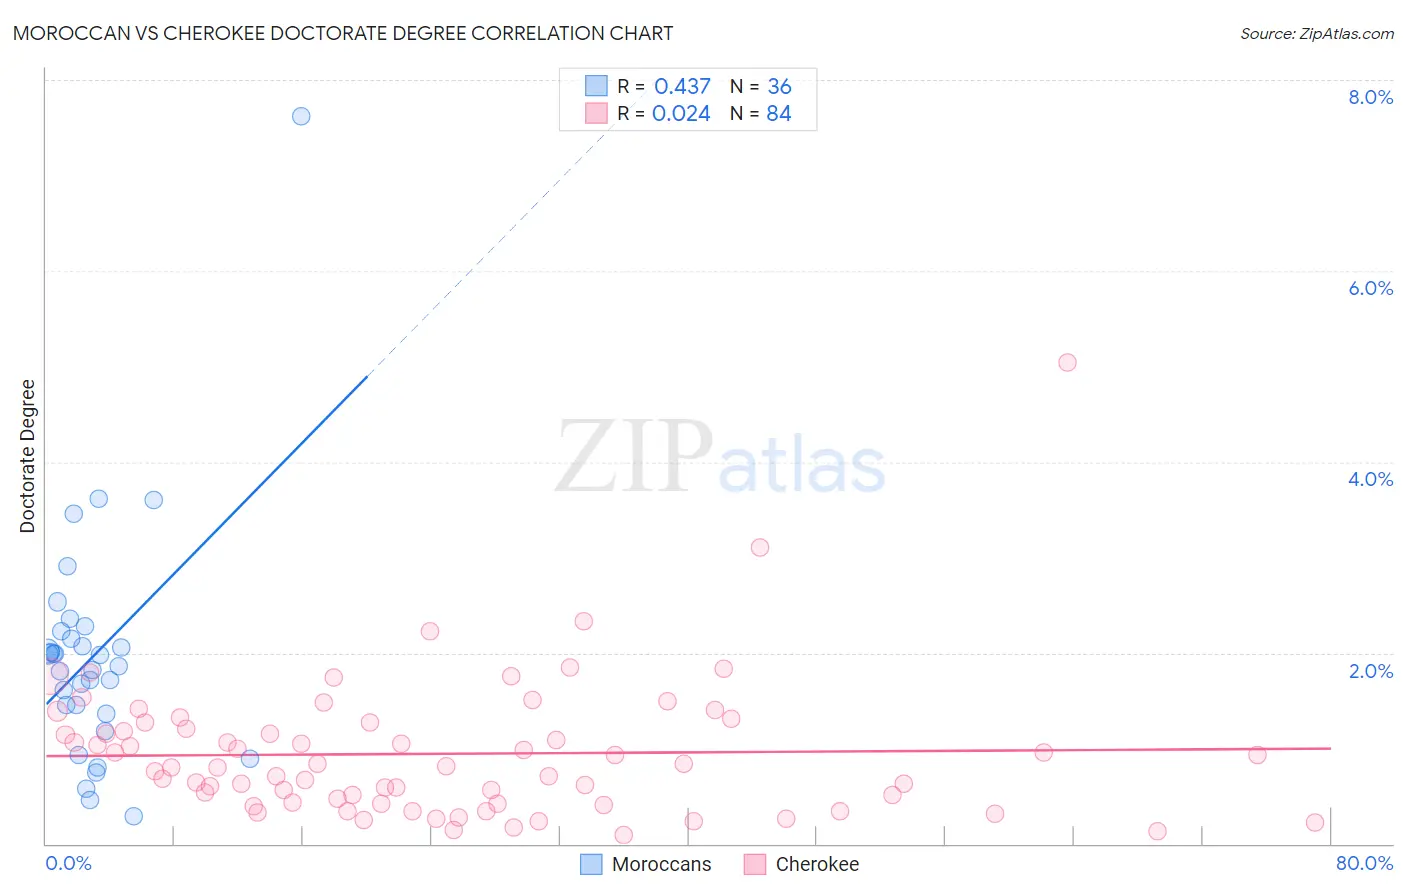
Moroccan vs Cherokee Doctorate Degree Correlation Chart
The statistical analysis conducted on geographies consisting of 201,333,401 people shows a moderate positive correlation between the proportion of Moroccans and percentage of population with at least doctorate degree education in the United States with a correlation coefficient (R) of 0.437 and weighted average of 2.0%. Similarly, the statistical analysis conducted on geographies consisting of 478,818,263 people shows no correlation between the proportion of Cherokee and percentage of population with at least doctorate degree education in the United States with a correlation coefficient (R) of 0.024 and weighted average of 1.5%, a difference of 38.5%.
Doctorate Degree Correlation Summary
| Measurement | Moroccan | Cherokee |
| Minimum | 0.29% | 0.091% |
| Maximum | 7.6% | 5.0% |
| Range | 7.3% | 5.0% |
| Mean | 2.0% | 0.94% |
| Median | 1.9% | 0.81% |
| Interquartile 25% (IQ1) | 1.4% | 0.43% |
| Interquartile 75% (IQ3) | 2.2% | 1.2% |
| Interquartile Range (IQR) | 0.79% | 0.81% |
| Standard Deviation (Sample) | 1.3% | 0.73% |
| Standard Deviation (Population) | 1.2% | 0.72% |
Similar Demographics by Doctorate Degree
Demographics Similar to Moroccans by Doctorate Degree
In terms of doctorate degree, the demographic groups most similar to Moroccans are Ute (2.0%, a difference of 0.11%), Jordanian (2.0%, a difference of 0.42%), Palestinian (2.0%, a difference of 0.45%), Croatian (2.0%, a difference of 0.58%), and Immigrants from Zaire (2.0%, a difference of 0.87%).
| Demographics | Rating | Rank | Doctorate Degree |
| Icelanders | 96.0 /100 | #118 | Exceptional 2.1% |
| Pakistanis | 95.8 /100 | #119 | Exceptional 2.0% |
| Immigrants | Morocco | 95.5 /100 | #120 | Exceptional 2.0% |
| Immigrants | Jordan | 94.8 /100 | #121 | Exceptional 2.0% |
| Immigrants | Southern Europe | 94.7 /100 | #122 | Exceptional 2.0% |
| Croatians | 94.0 /100 | #123 | Exceptional 2.0% |
| Ute | 93.2 /100 | #124 | Exceptional 2.0% |
| Moroccans | 93.0 /100 | #125 | Exceptional 2.0% |
| Jordanians | 92.1 /100 | #126 | Exceptional 2.0% |
| Palestinians | 92.0 /100 | #127 | Exceptional 2.0% |
| Immigrants | Zaire | 91.1 /100 | #128 | Exceptional 2.0% |
| Canadians | 90.6 /100 | #129 | Exceptional 2.0% |
| Immigrants | Ukraine | 90.5 /100 | #130 | Exceptional 2.0% |
| Immigrants | Sierra Leone | 90.2 /100 | #131 | Exceptional 2.0% |
| Scottish | 89.4 /100 | #132 | Excellent 2.0% |
Demographics Similar to Cherokee by Doctorate Degree
In terms of doctorate degree, the demographic groups most similar to Cherokee are Cajun (1.5%, a difference of 0.17%), Malaysian (1.5%, a difference of 0.18%), Jamaican (1.5%, a difference of 0.21%), Central American (1.5%, a difference of 0.24%), and British West Indian (1.5%, a difference of 0.29%).
| Demographics | Rating | Rank | Doctorate Degree |
| Marshallese | 0.4 /100 | #279 | Tragic 1.5% |
| Ecuadorians | 0.4 /100 | #280 | Tragic 1.5% |
| Tohono O'odham | 0.4 /100 | #281 | Tragic 1.5% |
| British West Indians | 0.3 /100 | #282 | Tragic 1.5% |
| Central Americans | 0.3 /100 | #283 | Tragic 1.5% |
| Jamaicans | 0.3 /100 | #284 | Tragic 1.5% |
| Malaysians | 0.3 /100 | #285 | Tragic 1.5% |
| Cherokee | 0.3 /100 | #286 | Tragic 1.5% |
| Cajuns | 0.3 /100 | #287 | Tragic 1.5% |
| Immigrants | El Salvador | 0.3 /100 | #288 | Tragic 1.4% |
| Cape Verdeans | 0.3 /100 | #289 | Tragic 1.4% |
| Choctaw | 0.3 /100 | #290 | Tragic 1.4% |
| Blacks/African Americans | 0.3 /100 | #291 | Tragic 1.4% |
| Alaska Natives | 0.3 /100 | #292 | Tragic 1.4% |
| Immigrants | Yemen | 0.2 /100 | #293 | Tragic 1.4% |