Moroccan vs Immigrants from Switzerland Doctorate Degree
COMPARE
Moroccan
Immigrants from Switzerland
Doctorate Degree
Doctorate Degree Comparison
Moroccans
Immigrants from Switzerland
2.0%
DOCTORATE DEGREE
93.0/ 100
METRIC RATING
125th/ 347
METRIC RANK
3.1%
DOCTORATE DEGREE
100.0/ 100
METRIC RATING
6th/ 347
METRIC RANK
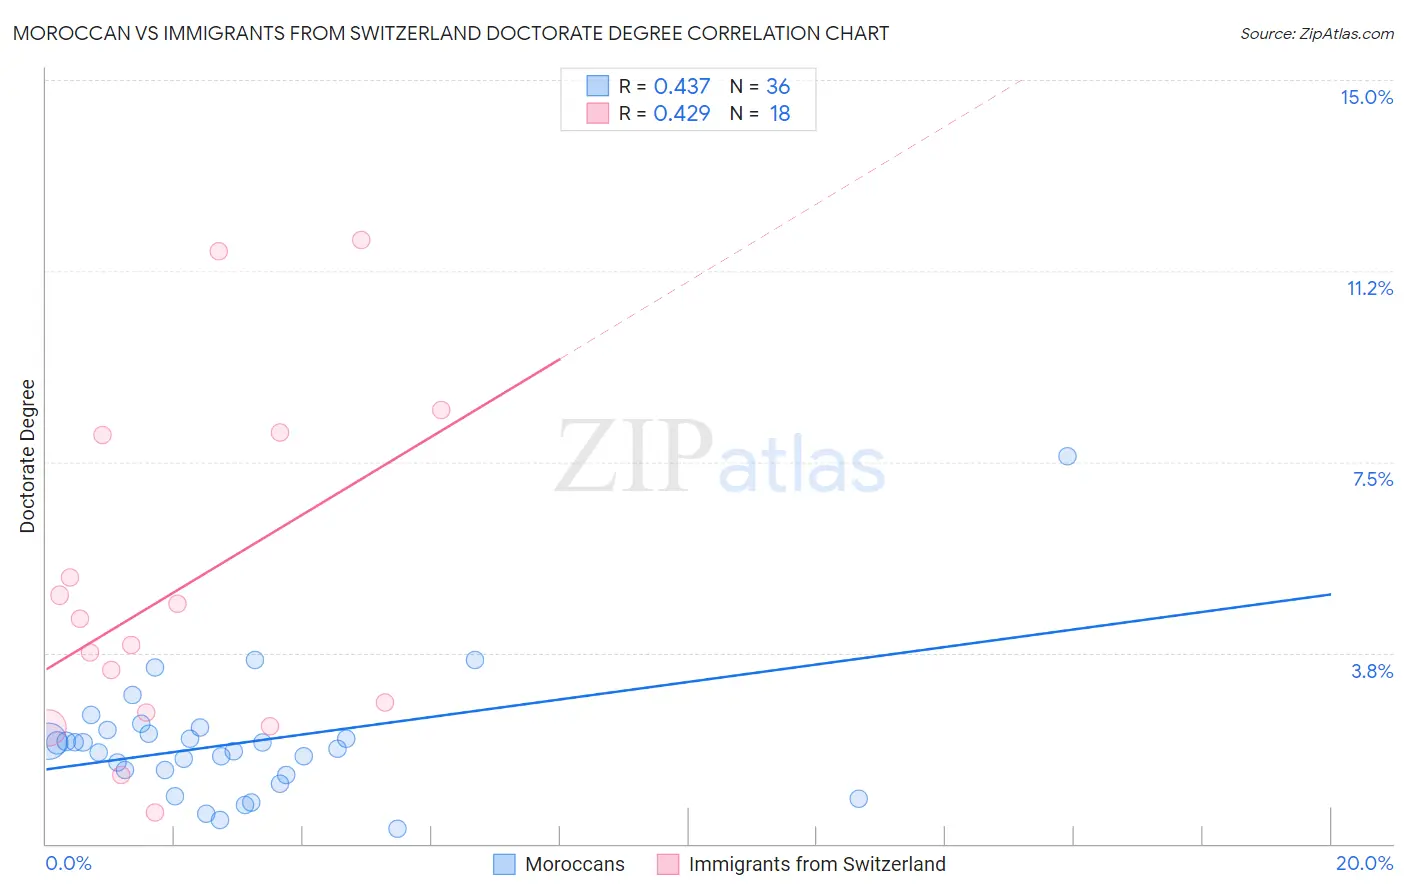
Moroccan vs Immigrants from Switzerland Doctorate Degree Correlation Chart
The statistical analysis conducted on geographies consisting of 201,333,401 people shows a moderate positive correlation between the proportion of Moroccans and percentage of population with at least doctorate degree education in the United States with a correlation coefficient (R) of 0.437 and weighted average of 2.0%. Similarly, the statistical analysis conducted on geographies consisting of 147,873,421 people shows a moderate positive correlation between the proportion of Immigrants from Switzerland and percentage of population with at least doctorate degree education in the United States with a correlation coefficient (R) of 0.429 and weighted average of 3.1%, a difference of 53.5%.
Doctorate Degree Correlation Summary
| Measurement | Moroccan | Immigrants from Switzerland |
| Minimum | 0.29% | 0.62% |
| Maximum | 7.6% | 11.8% |
| Range | 7.3% | 11.2% |
| Mean | 2.0% | 5.0% |
| Median | 1.9% | 4.2% |
| Interquartile 25% (IQ1) | 1.4% | 2.6% |
| Interquartile 75% (IQ3) | 2.2% | 8.0% |
| Interquartile Range (IQR) | 0.79% | 5.5% |
| Standard Deviation (Sample) | 1.3% | 3.3% |
| Standard Deviation (Population) | 1.2% | 3.2% |
Similar Demographics by Doctorate Degree
Demographics Similar to Moroccans by Doctorate Degree
In terms of doctorate degree, the demographic groups most similar to Moroccans are Ute (2.0%, a difference of 0.11%), Jordanian (2.0%, a difference of 0.42%), Palestinian (2.0%, a difference of 0.45%), Croatian (2.0%, a difference of 0.58%), and Immigrants from Zaire (2.0%, a difference of 0.87%).
| Demographics | Rating | Rank | Doctorate Degree |
| Icelanders | 96.0 /100 | #118 | Exceptional 2.1% |
| Pakistanis | 95.8 /100 | #119 | Exceptional 2.0% |
| Immigrants | Morocco | 95.5 /100 | #120 | Exceptional 2.0% |
| Immigrants | Jordan | 94.8 /100 | #121 | Exceptional 2.0% |
| Immigrants | Southern Europe | 94.7 /100 | #122 | Exceptional 2.0% |
| Croatians | 94.0 /100 | #123 | Exceptional 2.0% |
| Ute | 93.2 /100 | #124 | Exceptional 2.0% |
| Moroccans | 93.0 /100 | #125 | Exceptional 2.0% |
| Jordanians | 92.1 /100 | #126 | Exceptional 2.0% |
| Palestinians | 92.0 /100 | #127 | Exceptional 2.0% |
| Immigrants | Zaire | 91.1 /100 | #128 | Exceptional 2.0% |
| Canadians | 90.6 /100 | #129 | Exceptional 2.0% |
| Immigrants | Ukraine | 90.5 /100 | #130 | Exceptional 2.0% |
| Immigrants | Sierra Leone | 90.2 /100 | #131 | Exceptional 2.0% |
| Scottish | 89.4 /100 | #132 | Excellent 2.0% |
Demographics Similar to Immigrants from Switzerland by Doctorate Degree
In terms of doctorate degree, the demographic groups most similar to Immigrants from Switzerland are Immigrants from China (3.1%, a difference of 0.070%), Immigrants from Israel (3.0%, a difference of 1.4%), Iranian (3.1%, a difference of 1.9%), Immigrants from Iran (3.0%, a difference of 2.1%), and Immigrants from Taiwan (3.2%, a difference of 3.5%).
| Demographics | Rating | Rank | Doctorate Degree |
| Immigrants | Singapore | 100.0 /100 | #1 | Exceptional 3.7% |
| Filipinos | 100.0 /100 | #2 | Exceptional 3.4% |
| Okinawans | 100.0 /100 | #3 | Exceptional 3.3% |
| Immigrants | Taiwan | 100.0 /100 | #4 | Exceptional 3.2% |
| Iranians | 100.0 /100 | #5 | Exceptional 3.1% |
| Immigrants | Switzerland | 100.0 /100 | #6 | Exceptional 3.1% |
| Immigrants | China | 100.0 /100 | #7 | Exceptional 3.1% |
| Immigrants | Israel | 100.0 /100 | #8 | Exceptional 3.0% |
| Immigrants | Iran | 100.0 /100 | #9 | Exceptional 3.0% |
| Immigrants | Eastern Asia | 100.0 /100 | #10 | Exceptional 3.0% |
| Indians (Asian) | 100.0 /100 | #11 | Exceptional 2.9% |
| Immigrants | Belgium | 100.0 /100 | #12 | Exceptional 2.9% |
| Immigrants | Sweden | 100.0 /100 | #13 | Exceptional 2.9% |
| Immigrants | France | 100.0 /100 | #14 | Exceptional 2.9% |
| Immigrants | India | 100.0 /100 | #15 | Exceptional 2.8% |