Moroccan vs Sudanese Doctorate Degree
COMPARE
Moroccan
Sudanese
Doctorate Degree
Doctorate Degree Comparison
Moroccans
Sudanese
2.0%
DOCTORATE DEGREE
93.0/ 100
METRIC RATING
125th/ 347
METRIC RANK
2.1%
DOCTORATE DEGREE
97.7/ 100
METRIC RATING
106th/ 347
METRIC RANK
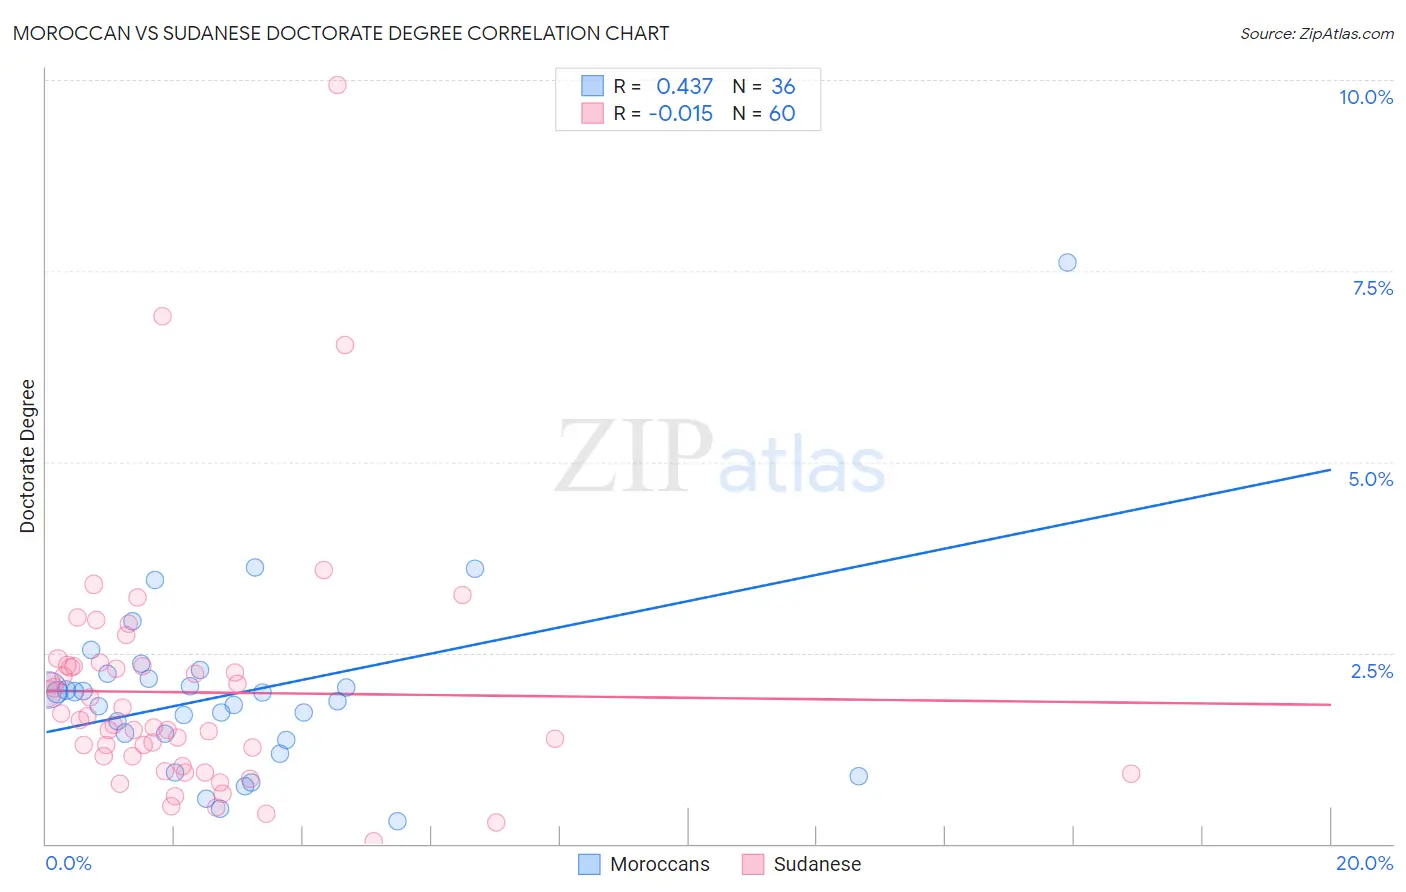
Moroccan vs Sudanese Doctorate Degree Correlation Chart
The statistical analysis conducted on geographies consisting of 201,333,401 people shows a moderate positive correlation between the proportion of Moroccans and percentage of population with at least doctorate degree education in the United States with a correlation coefficient (R) of 0.437 and weighted average of 2.0%. Similarly, the statistical analysis conducted on geographies consisting of 109,863,748 people shows no correlation between the proportion of Sudanese and percentage of population with at least doctorate degree education in the United States with a correlation coefficient (R) of -0.015 and weighted average of 2.1%, a difference of 4.0%.
Doctorate Degree Correlation Summary
| Measurement | Moroccan | Sudanese |
| Minimum | 0.29% | 0.038% |
| Maximum | 7.6% | 9.9% |
| Range | 7.3% | 9.9% |
| Mean | 2.0% | 2.0% |
| Median | 1.9% | 1.6% |
| Interquartile 25% (IQ1) | 1.4% | 1.1% |
| Interquartile 75% (IQ3) | 2.2% | 2.3% |
| Interquartile Range (IQR) | 0.79% | 1.2% |
| Standard Deviation (Sample) | 1.3% | 1.6% |
| Standard Deviation (Population) | 1.2% | 1.6% |
Demographics Similar to Moroccans and Sudanese by Doctorate Degree
In terms of doctorate degree, the demographic groups most similar to Moroccans are Ute (2.0%, a difference of 0.11%), Croatian (2.0%, a difference of 0.58%), Immigrants from Southern Europe (2.0%, a difference of 1.0%), Immigrants from Jordan (2.0%, a difference of 1.1%), and Immigrants from Morocco (2.0%, a difference of 1.5%). Similarly, the demographic groups most similar to Sudanese are Arab (2.1%, a difference of 0.10%), European (2.1%, a difference of 0.39%), Immigrants from Germany (2.1%, a difference of 0.62%), Ukrainian (2.1%, a difference of 0.67%), and Brazilian (2.1%, a difference of 0.75%).
| Demographics | Rating | Rank | Doctorate Degree |
| Arabs | 97.8 /100 | #105 | Exceptional 2.1% |
| Sudanese | 97.7 /100 | #106 | Exceptional 2.1% |
| Europeans | 97.5 /100 | #107 | Exceptional 2.1% |
| Immigrants | Germany | 97.3 /100 | #108 | Exceptional 2.1% |
| Ukrainians | 97.2 /100 | #109 | Exceptional 2.1% |
| Brazilians | 97.2 /100 | #110 | Exceptional 2.1% |
| Immigrants | Pakistan | 97.1 /100 | #111 | Exceptional 2.1% |
| Syrians | 97.1 /100 | #112 | Exceptional 2.1% |
| Immigrants | Italy | 96.9 /100 | #113 | Exceptional 2.1% |
| Immigrants | Croatia | 96.8 /100 | #114 | Exceptional 2.1% |
| Taiwanese | 96.7 /100 | #115 | Exceptional 2.1% |
| Maltese | 96.2 /100 | #116 | Exceptional 2.1% |
| Lebanese | 96.0 /100 | #117 | Exceptional 2.1% |
| Icelanders | 96.0 /100 | #118 | Exceptional 2.1% |
| Pakistanis | 95.8 /100 | #119 | Exceptional 2.0% |
| Immigrants | Morocco | 95.5 /100 | #120 | Exceptional 2.0% |
| Immigrants | Jordan | 94.8 /100 | #121 | Exceptional 2.0% |
| Immigrants | Southern Europe | 94.7 /100 | #122 | Exceptional 2.0% |
| Croatians | 94.0 /100 | #123 | Exceptional 2.0% |
| Ute | 93.2 /100 | #124 | Exceptional 2.0% |
| Moroccans | 93.0 /100 | #125 | Exceptional 2.0% |