Moroccan vs Immigrants from Venezuela Doctorate Degree
COMPARE
Moroccan
Immigrants from Venezuela
Doctorate Degree
Doctorate Degree Comparison
Moroccans
Immigrants from Venezuela
2.0%
DOCTORATE DEGREE
93.0/ 100
METRIC RATING
125th/ 347
METRIC RANK
1.7%
DOCTORATE DEGREE
8.7/ 100
METRIC RATING
222nd/ 347
METRIC RANK
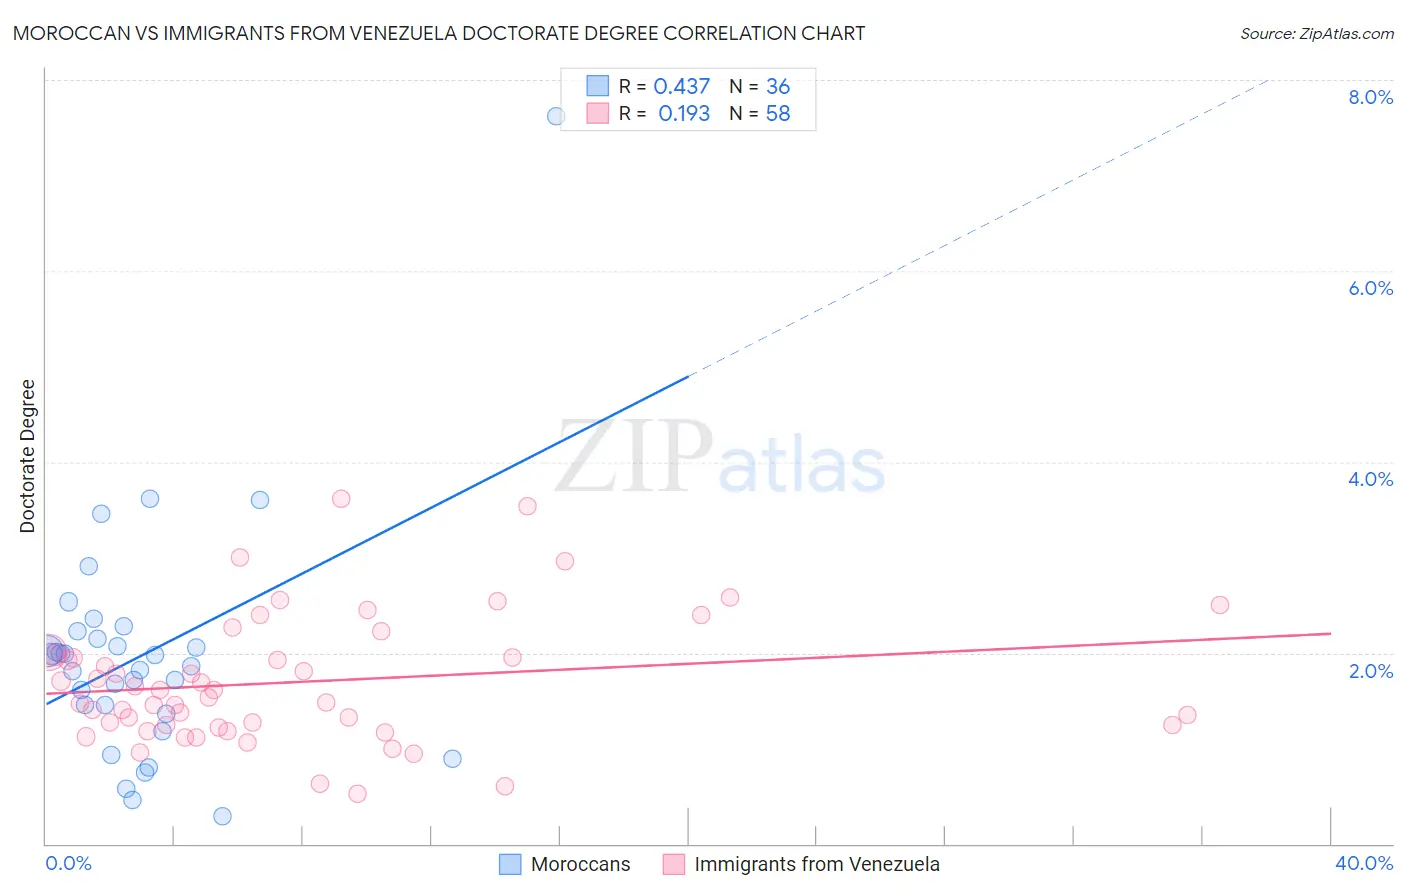
Moroccan vs Immigrants from Venezuela Doctorate Degree Correlation Chart
The statistical analysis conducted on geographies consisting of 201,333,401 people shows a moderate positive correlation between the proportion of Moroccans and percentage of population with at least doctorate degree education in the United States with a correlation coefficient (R) of 0.437 and weighted average of 2.0%. Similarly, the statistical analysis conducted on geographies consisting of 286,408,537 people shows a poor positive correlation between the proportion of Immigrants from Venezuela and percentage of population with at least doctorate degree education in the United States with a correlation coefficient (R) of 0.193 and weighted average of 1.7%, a difference of 19.8%.
Doctorate Degree Correlation Summary
| Measurement | Moroccan | Immigrants from Venezuela |
| Minimum | 0.29% | 0.53% |
| Maximum | 7.6% | 3.6% |
| Range | 7.3% | 3.1% |
| Mean | 2.0% | 1.7% |
| Median | 1.9% | 1.6% |
| Interquartile 25% (IQ1) | 1.4% | 1.2% |
| Interquartile 75% (IQ3) | 2.2% | 2.0% |
| Interquartile Range (IQR) | 0.79% | 0.73% |
| Standard Deviation (Sample) | 1.3% | 0.67% |
| Standard Deviation (Population) | 1.2% | 0.66% |
Similar Demographics by Doctorate Degree
Demographics Similar to Moroccans by Doctorate Degree
In terms of doctorate degree, the demographic groups most similar to Moroccans are Ute (2.0%, a difference of 0.11%), Jordanian (2.0%, a difference of 0.42%), Palestinian (2.0%, a difference of 0.45%), Croatian (2.0%, a difference of 0.58%), and Immigrants from Zaire (2.0%, a difference of 0.87%).
| Demographics | Rating | Rank | Doctorate Degree |
| Icelanders | 96.0 /100 | #118 | Exceptional 2.1% |
| Pakistanis | 95.8 /100 | #119 | Exceptional 2.0% |
| Immigrants | Morocco | 95.5 /100 | #120 | Exceptional 2.0% |
| Immigrants | Jordan | 94.8 /100 | #121 | Exceptional 2.0% |
| Immigrants | Southern Europe | 94.7 /100 | #122 | Exceptional 2.0% |
| Croatians | 94.0 /100 | #123 | Exceptional 2.0% |
| Ute | 93.2 /100 | #124 | Exceptional 2.0% |
| Moroccans | 93.0 /100 | #125 | Exceptional 2.0% |
| Jordanians | 92.1 /100 | #126 | Exceptional 2.0% |
| Palestinians | 92.0 /100 | #127 | Exceptional 2.0% |
| Immigrants | Zaire | 91.1 /100 | #128 | Exceptional 2.0% |
| Canadians | 90.6 /100 | #129 | Exceptional 2.0% |
| Immigrants | Ukraine | 90.5 /100 | #130 | Exceptional 2.0% |
| Immigrants | Sierra Leone | 90.2 /100 | #131 | Exceptional 2.0% |
| Scottish | 89.4 /100 | #132 | Excellent 2.0% |
Demographics Similar to Immigrants from Venezuela by Doctorate Degree
In terms of doctorate degree, the demographic groups most similar to Immigrants from Venezuela are Nonimmigrants (1.7%, a difference of 0.070%), Immigrants from Uruguay (1.7%, a difference of 0.26%), Immigrants from Bosnia and Herzegovina (1.7%, a difference of 0.46%), Immigrants from Poland (1.7%, a difference of 0.68%), and Immigrants from Iraq (1.7%, a difference of 0.92%).
| Demographics | Rating | Rank | Doctorate Degree |
| Alaskan Athabascans | 13.8 /100 | #215 | Poor 1.7% |
| Immigrants | Burma/Myanmar | 13.5 /100 | #216 | Poor 1.7% |
| Spanish Americans | 12.9 /100 | #217 | Poor 1.7% |
| Tlingit-Haida | 11.9 /100 | #218 | Poor 1.7% |
| Immigrants | Iraq | 10.7 /100 | #219 | Poor 1.7% |
| Immigrants | Uruguay | 9.2 /100 | #220 | Tragic 1.7% |
| Immigrants | Nonimmigrants | 8.8 /100 | #221 | Tragic 1.7% |
| Immigrants | Venezuela | 8.7 /100 | #222 | Tragic 1.7% |
| Immigrants | Bosnia and Herzegovina | 7.8 /100 | #223 | Tragic 1.7% |
| Immigrants | Poland | 7.4 /100 | #224 | Tragic 1.7% |
| Immigrants | Colombia | 6.7 /100 | #225 | Tragic 1.7% |
| Osage | 6.5 /100 | #226 | Tragic 1.7% |
| Panamanians | 6.3 /100 | #227 | Tragic 1.7% |
| Assyrians/Chaldeans/Syriacs | 5.9 /100 | #228 | Tragic 1.7% |
| Colville | 4.7 /100 | #229 | Tragic 1.6% |