Barbadian vs Chilean No Schooling Completed
COMPARE
Barbadian
Chilean
No Schooling Completed
No Schooling Completed Comparison
Barbadians
Chileans
2.6%
NO SCHOOLING COMPLETED
0.1/ 100
METRIC RATING
279th/ 347
METRIC RANK
2.0%
NO SCHOOLING COMPLETED
67.2/ 100
METRIC RATING
156th/ 347
METRIC RANK
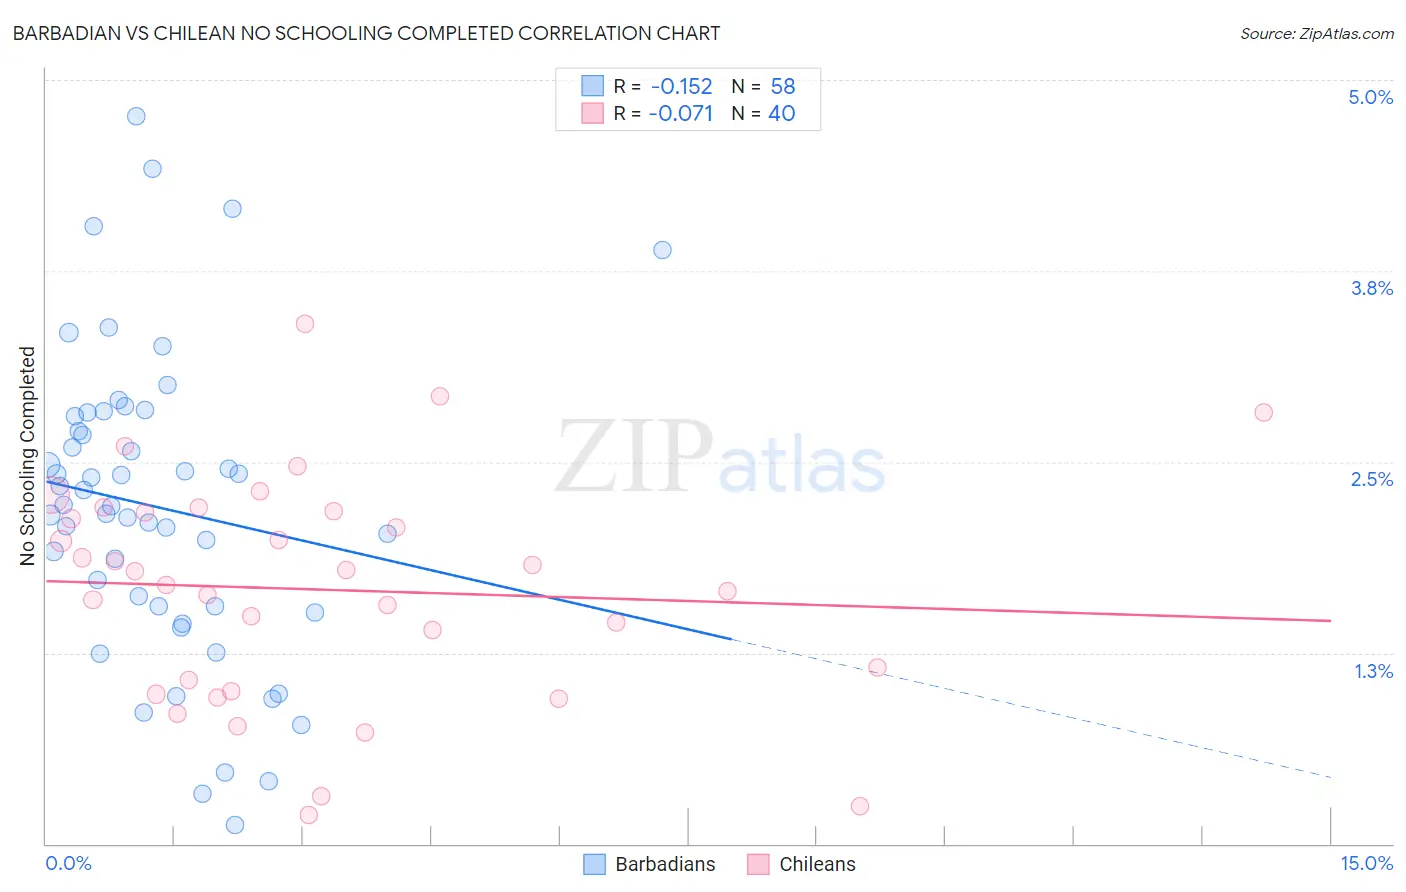
Barbadian vs Chilean No Schooling Completed Correlation Chart
The statistical analysis conducted on geographies consisting of 140,997,327 people shows a poor negative correlation between the proportion of Barbadians and percentage of population with no schooling in the United States with a correlation coefficient (R) of -0.152 and weighted average of 2.6%. Similarly, the statistical analysis conducted on geographies consisting of 255,430,535 people shows a slight negative correlation between the proportion of Chileans and percentage of population with no schooling in the United States with a correlation coefficient (R) of -0.071 and weighted average of 2.0%, a difference of 27.3%.
No Schooling Completed Correlation Summary
| Measurement | Barbadian | Chilean |
| Minimum | 0.12% | 0.19% |
| Maximum | 4.8% | 3.4% |
| Range | 4.6% | 3.2% |
| Mean | 2.2% | 1.7% |
| Median | 2.2% | 1.7% |
| Interquartile 25% (IQ1) | 1.6% | 1.0% |
| Interquartile 75% (IQ3) | 2.8% | 2.2% |
| Interquartile Range (IQR) | 1.2% | 1.1% |
| Standard Deviation (Sample) | 1.0% | 0.74% |
| Standard Deviation (Population) | 0.99% | 0.73% |
Similar Demographics by No Schooling Completed
Demographics Similar to Barbadians by No Schooling Completed
In terms of no schooling completed, the demographic groups most similar to Barbadians are Trinidadian and Tobagonian (2.6%, a difference of 0.020%), Afghan (2.6%, a difference of 0.10%), Immigrants from Ghana (2.6%, a difference of 0.30%), Immigrants from Uzbekistan (2.6%, a difference of 0.55%), and Immigrants from Philippines (2.6%, a difference of 0.74%).
| Demographics | Rating | Rank | No Schooling Completed |
| Immigrants | Bolivia | 0.2 /100 | #272 | Tragic 2.5% |
| Immigrants | Cameroon | 0.1 /100 | #273 | Tragic 2.5% |
| Ghanaians | 0.1 /100 | #274 | Tragic 2.6% |
| Immigrants | China | 0.1 /100 | #275 | Tragic 2.6% |
| Immigrants | Western Africa | 0.1 /100 | #276 | Tragic 2.6% |
| Immigrants | Philippines | 0.1 /100 | #277 | Tragic 2.6% |
| Immigrants | Uzbekistan | 0.1 /100 | #278 | Tragic 2.6% |
| Barbadians | 0.1 /100 | #279 | Tragic 2.6% |
| Trinidadians and Tobagonians | 0.1 /100 | #280 | Tragic 2.6% |
| Afghans | 0.1 /100 | #281 | Tragic 2.6% |
| Immigrants | Ghana | 0.1 /100 | #282 | Tragic 2.6% |
| Immigrants | Trinidad and Tobago | 0.0 /100 | #283 | Tragic 2.6% |
| Immigrants | West Indies | 0.0 /100 | #284 | Tragic 2.7% |
| Immigrants | Barbados | 0.0 /100 | #285 | Tragic 2.7% |
| Immigrants | Portugal | 0.0 /100 | #286 | Tragic 2.7% |
Demographics Similar to Chileans by No Schooling Completed
In terms of no schooling completed, the demographic groups most similar to Chileans are Immigrants from Sri Lanka (2.0%, a difference of 0.030%), Immigrants from Russia (2.0%, a difference of 0.070%), Immigrants from Korea (2.0%, a difference of 0.080%), Immigrants from Spain (2.0%, a difference of 0.12%), and Immigrants from Venezuela (2.0%, a difference of 0.21%).
| Demographics | Rating | Rank | No Schooling Completed |
| Immigrants | North Macedonia | 75.9 /100 | #149 | Good 2.0% |
| Blackfeet | 72.9 /100 | #150 | Good 2.0% |
| Immigrants | Jordan | 70.9 /100 | #151 | Good 2.0% |
| Immigrants | Eastern Europe | 70.4 /100 | #152 | Good 2.0% |
| Immigrants | Italy | 68.9 /100 | #153 | Good 2.0% |
| Immigrants | Venezuela | 68.5 /100 | #154 | Good 2.0% |
| Immigrants | Russia | 67.6 /100 | #155 | Good 2.0% |
| Chileans | 67.2 /100 | #156 | Good 2.0% |
| Immigrants | Sri Lanka | 67.0 /100 | #157 | Good 2.0% |
| Immigrants | Korea | 66.7 /100 | #158 | Good 2.0% |
| Immigrants | Spain | 66.4 /100 | #159 | Good 2.0% |
| Kenyans | 65.7 /100 | #160 | Good 2.0% |
| Ugandans | 64.6 /100 | #161 | Good 2.0% |
| Immigrants | Brazil | 63.8 /100 | #162 | Good 2.1% |
| Albanians | 62.2 /100 | #163 | Good 2.1% |