Luxembourger vs Chilean No Schooling Completed
COMPARE
Luxembourger
Chilean
No Schooling Completed
No Schooling Completed Comparison
Luxembourgers
Chileans
1.6%
NO SCHOOLING COMPLETED
99.9/ 100
METRIC RATING
40th/ 347
METRIC RANK
2.0%
NO SCHOOLING COMPLETED
67.2/ 100
METRIC RATING
156th/ 347
METRIC RANK
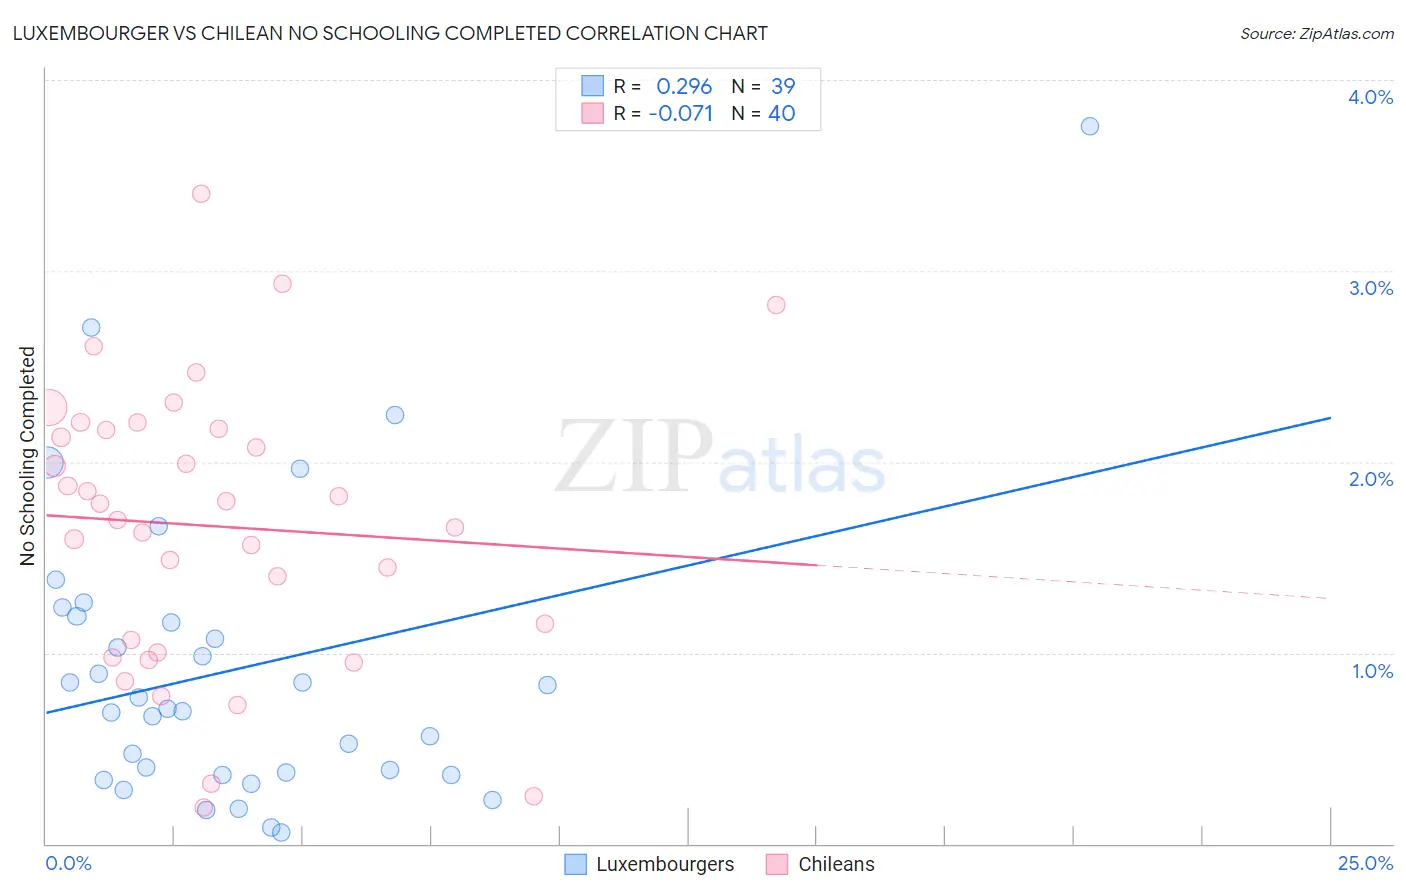
Luxembourger vs Chilean No Schooling Completed Correlation Chart
The statistical analysis conducted on geographies consisting of 143,533,879 people shows a weak positive correlation between the proportion of Luxembourgers and percentage of population with no schooling in the United States with a correlation coefficient (R) of 0.296 and weighted average of 1.6%. Similarly, the statistical analysis conducted on geographies consisting of 255,430,535 people shows a slight negative correlation between the proportion of Chileans and percentage of population with no schooling in the United States with a correlation coefficient (R) of -0.071 and weighted average of 2.0%, a difference of 28.5%.
No Schooling Completed Correlation Summary
| Measurement | Luxembourger | Chilean |
| Minimum | 0.062% | 0.19% |
| Maximum | 3.8% | 3.4% |
| Range | 3.7% | 3.2% |
| Mean | 0.91% | 1.7% |
| Median | 0.71% | 1.7% |
| Interquartile 25% (IQ1) | 0.36% | 1.0% |
| Interquartile 75% (IQ3) | 1.2% | 2.2% |
| Interquartile Range (IQR) | 0.83% | 1.1% |
| Standard Deviation (Sample) | 0.77% | 0.74% |
| Standard Deviation (Population) | 0.76% | 0.73% |
Similar Demographics by No Schooling Completed
Demographics Similar to Luxembourgers by No Schooling Completed
In terms of no schooling completed, the demographic groups most similar to Luxembourgers are Hungarian (1.6%, a difference of 0.27%), Native Hawaiian (1.6%, a difference of 0.35%), Northern European (1.6%, a difference of 0.61%), Belgian (1.6%, a difference of 0.75%), and Aleut (1.6%, a difference of 1.0%).
| Demographics | Rating | Rank | No Schooling Completed |
| Italians | 100.0 /100 | #33 | Exceptional 1.5% |
| Latvians | 100.0 /100 | #34 | Exceptional 1.5% |
| Eastern Europeans | 100.0 /100 | #35 | Exceptional 1.6% |
| Aleuts | 99.9 /100 | #36 | Exceptional 1.6% |
| Belgians | 99.9 /100 | #37 | Exceptional 1.6% |
| Northern Europeans | 99.9 /100 | #38 | Exceptional 1.6% |
| Native Hawaiians | 99.9 /100 | #39 | Exceptional 1.6% |
| Luxembourgers | 99.9 /100 | #40 | Exceptional 1.6% |
| Hungarians | 99.9 /100 | #41 | Exceptional 1.6% |
| Bulgarians | 99.9 /100 | #42 | Exceptional 1.6% |
| Australians | 99.9 /100 | #43 | Exceptional 1.6% |
| Estonians | 99.9 /100 | #44 | Exceptional 1.6% |
| Czechoslovakians | 99.9 /100 | #45 | Exceptional 1.6% |
| Maltese | 99.9 /100 | #46 | Exceptional 1.6% |
| Ottawa | 99.9 /100 | #47 | Exceptional 1.6% |
Demographics Similar to Chileans by No Schooling Completed
In terms of no schooling completed, the demographic groups most similar to Chileans are Immigrants from Sri Lanka (2.0%, a difference of 0.030%), Immigrants from Russia (2.0%, a difference of 0.070%), Immigrants from Korea (2.0%, a difference of 0.080%), Immigrants from Spain (2.0%, a difference of 0.12%), and Immigrants from Venezuela (2.0%, a difference of 0.21%).
| Demographics | Rating | Rank | No Schooling Completed |
| Immigrants | North Macedonia | 75.9 /100 | #149 | Good 2.0% |
| Blackfeet | 72.9 /100 | #150 | Good 2.0% |
| Immigrants | Jordan | 70.9 /100 | #151 | Good 2.0% |
| Immigrants | Eastern Europe | 70.4 /100 | #152 | Good 2.0% |
| Immigrants | Italy | 68.9 /100 | #153 | Good 2.0% |
| Immigrants | Venezuela | 68.5 /100 | #154 | Good 2.0% |
| Immigrants | Russia | 67.6 /100 | #155 | Good 2.0% |
| Chileans | 67.2 /100 | #156 | Good 2.0% |
| Immigrants | Sri Lanka | 67.0 /100 | #157 | Good 2.0% |
| Immigrants | Korea | 66.7 /100 | #158 | Good 2.0% |
| Immigrants | Spain | 66.4 /100 | #159 | Good 2.0% |
| Kenyans | 65.7 /100 | #160 | Good 2.0% |
| Ugandans | 64.6 /100 | #161 | Good 2.0% |
| Immigrants | Brazil | 63.8 /100 | #162 | Good 2.1% |
| Albanians | 62.2 /100 | #163 | Good 2.1% |