Immigrants from Moldova vs Chilean No Schooling Completed
COMPARE
Immigrants from Moldova
Chilean
No Schooling Completed
No Schooling Completed Comparison
Immigrants from Moldova
Chileans
2.0%
NO SCHOOLING COMPLETED
78.0/ 100
METRIC RATING
146th/ 347
METRIC RANK
2.0%
NO SCHOOLING COMPLETED
67.2/ 100
METRIC RATING
156th/ 347
METRIC RANK
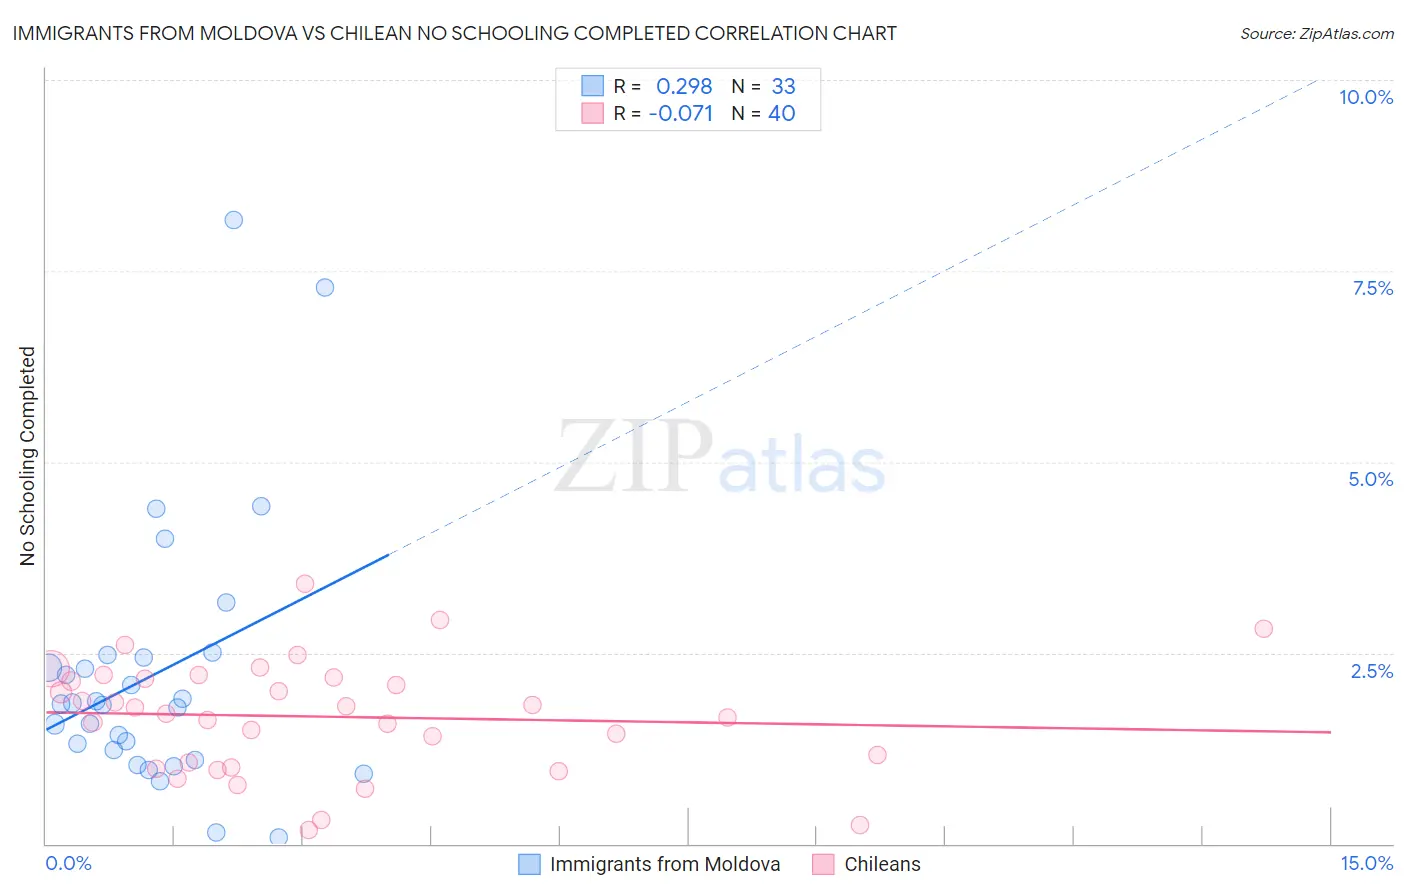
Immigrants from Moldova vs Chilean No Schooling Completed Correlation Chart
The statistical analysis conducted on geographies consisting of 123,856,297 people shows a weak positive correlation between the proportion of Immigrants from Moldova and percentage of population with no schooling in the United States with a correlation coefficient (R) of 0.298 and weighted average of 2.0%. Similarly, the statistical analysis conducted on geographies consisting of 255,430,535 people shows a slight negative correlation between the proportion of Chileans and percentage of population with no schooling in the United States with a correlation coefficient (R) of -0.071 and weighted average of 2.0%, a difference of 1.9%.
No Schooling Completed Correlation Summary
| Measurement | Immigrants from Moldova | Chilean |
| Minimum | 0.082% | 0.19% |
| Maximum | 8.2% | 3.4% |
| Range | 8.1% | 3.2% |
| Mean | 2.2% | 1.7% |
| Median | 1.8% | 1.7% |
| Interquartile 25% (IQ1) | 1.2% | 1.0% |
| Interquartile 75% (IQ3) | 2.5% | 2.2% |
| Interquartile Range (IQR) | 1.3% | 1.1% |
| Standard Deviation (Sample) | 1.8% | 0.74% |
| Standard Deviation (Population) | 1.7% | 0.73% |
Demographics Similar to Immigrants from Moldova and Chileans by No Schooling Completed
In terms of no schooling completed, the demographic groups most similar to Immigrants from Moldova are Soviet Union (2.0%, a difference of 0.17%), Immigrants from Iran (2.0%, a difference of 0.21%), Alsatian (2.0%, a difference of 0.22%), Shoshone (2.0%, a difference of 0.26%), and Immigrants from North Macedonia (2.0%, a difference of 0.41%). Similarly, the demographic groups most similar to Chileans are Immigrants from Sri Lanka (2.0%, a difference of 0.030%), Immigrants from Russia (2.0%, a difference of 0.070%), Immigrants from Korea (2.0%, a difference of 0.080%), Immigrants from Spain (2.0%, a difference of 0.12%), and Immigrants from Venezuela (2.0%, a difference of 0.21%).
| Demographics | Rating | Rank | No Schooling Completed |
| Immigrants | Greece | 83.5 /100 | #141 | Excellent 2.0% |
| Venezuelans | 81.5 /100 | #142 | Excellent 2.0% |
| Immigrants | South Central Asia | 80.0 /100 | #143 | Good 2.0% |
| Alsatians | 79.1 /100 | #144 | Good 2.0% |
| Immigrants | Iran | 79.0 /100 | #145 | Good 2.0% |
| Immigrants | Moldova | 78.0 /100 | #146 | Good 2.0% |
| Soviet Union | 77.1 /100 | #147 | Good 2.0% |
| Shoshone | 76.7 /100 | #148 | Good 2.0% |
| Immigrants | North Macedonia | 75.9 /100 | #149 | Good 2.0% |
| Blackfeet | 72.9 /100 | #150 | Good 2.0% |
| Immigrants | Jordan | 70.9 /100 | #151 | Good 2.0% |
| Immigrants | Eastern Europe | 70.4 /100 | #152 | Good 2.0% |
| Immigrants | Italy | 68.9 /100 | #153 | Good 2.0% |
| Immigrants | Venezuela | 68.5 /100 | #154 | Good 2.0% |
| Immigrants | Russia | 67.6 /100 | #155 | Good 2.0% |
| Chileans | 67.2 /100 | #156 | Good 2.0% |
| Immigrants | Sri Lanka | 67.0 /100 | #157 | Good 2.0% |
| Immigrants | Korea | 66.7 /100 | #158 | Good 2.0% |
| Immigrants | Spain | 66.4 /100 | #159 | Good 2.0% |
| Kenyans | 65.7 /100 | #160 | Good 2.0% |
| Ugandans | 64.6 /100 | #161 | Good 2.0% |