Moroccan vs Immigrants from Zimbabwe Professional Degree
COMPARE
Moroccan
Immigrants from Zimbabwe
Professional Degree
Professional Degree Comparison
Moroccans
Immigrants from Zimbabwe
5.0%
PROFESSIONAL DEGREE
96.8/ 100
METRIC RATING
115th/ 347
METRIC RANK
5.3%
PROFESSIONAL DEGREE
99.6/ 100
METRIC RATING
85th/ 347
METRIC RANK
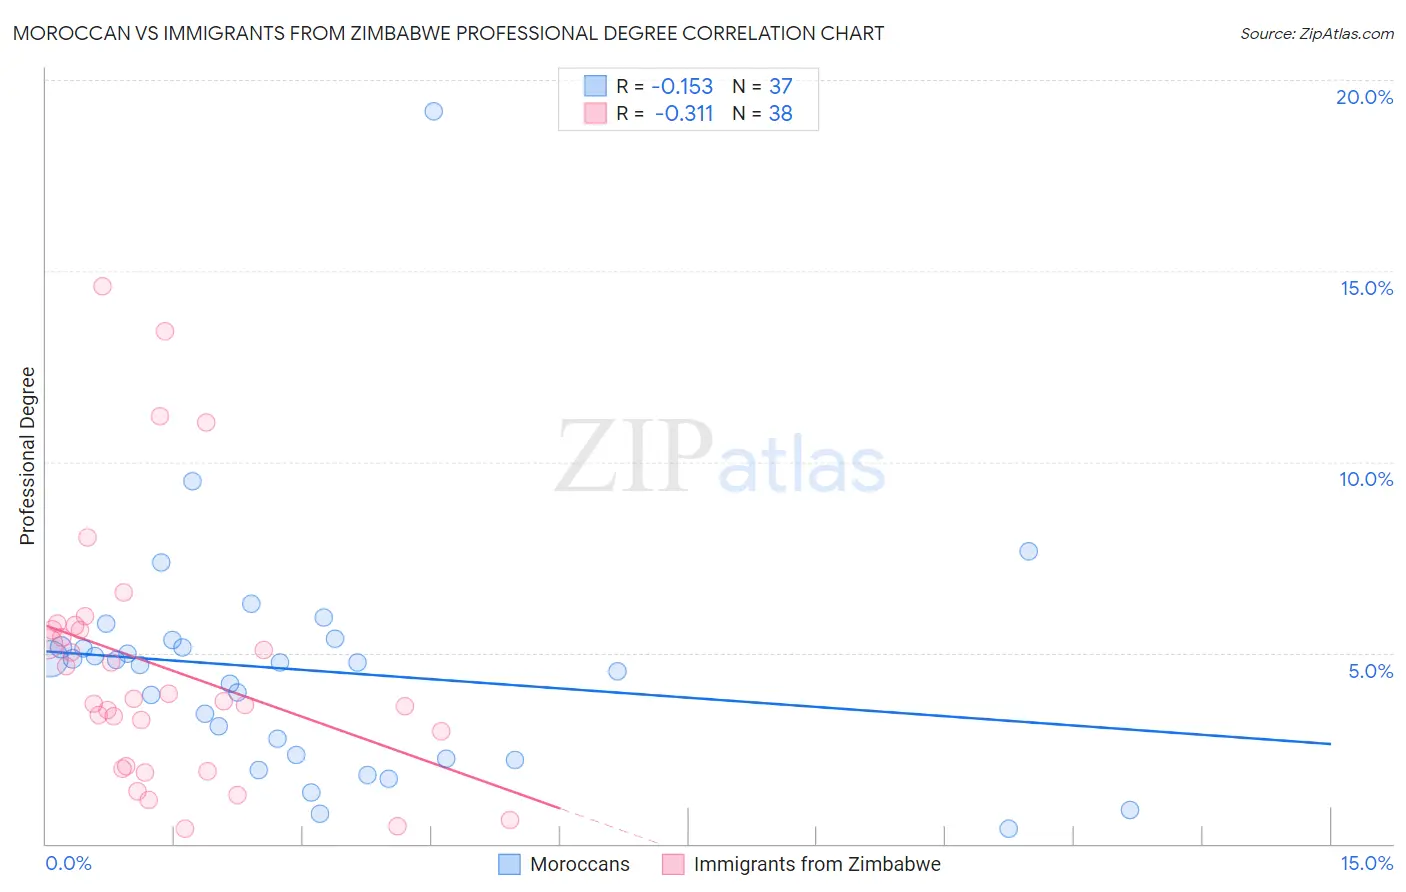
Moroccan vs Immigrants from Zimbabwe Professional Degree Correlation Chart
The statistical analysis conducted on geographies consisting of 201,703,459 people shows a poor negative correlation between the proportion of Moroccans and percentage of population with at least professional degree education in the United States with a correlation coefficient (R) of -0.153 and weighted average of 5.0%. Similarly, the statistical analysis conducted on geographies consisting of 117,758,651 people shows a mild negative correlation between the proportion of Immigrants from Zimbabwe and percentage of population with at least professional degree education in the United States with a correlation coefficient (R) of -0.311 and weighted average of 5.3%, a difference of 6.5%.
Professional Degree Correlation Summary
| Measurement | Moroccan | Immigrants from Zimbabwe |
| Minimum | 0.40% | 0.39% |
| Maximum | 19.2% | 14.6% |
| Range | 18.8% | 14.2% |
| Mean | 4.5% | 4.6% |
| Median | 4.7% | 3.8% |
| Interquartile 25% (IQ1) | 2.3% | 2.0% |
| Interquartile 75% (IQ3) | 5.2% | 5.6% |
| Interquartile Range (IQR) | 3.0% | 3.6% |
| Standard Deviation (Sample) | 3.2% | 3.3% |
| Standard Deviation (Population) | 3.1% | 3.3% |
Similar Demographics by Professional Degree
Demographics Similar to Moroccans by Professional Degree
In terms of professional degree, the demographic groups most similar to Moroccans are Immigrants from Morocco (5.0%, a difference of 0.10%), Venezuelan (4.9%, a difference of 0.47%), Immigrants from Pakistan (5.0%, a difference of 0.55%), Taiwanese (5.0%, a difference of 0.57%), and Immigrants from Syria (4.9%, a difference of 0.68%).
| Demographics | Rating | Rank | Professional Degree |
| Immigrants | Southern Europe | 98.1 /100 | #108 | Exceptional 5.0% |
| British | 98.0 /100 | #109 | Exceptional 5.0% |
| Lebanese | 98.0 /100 | #110 | Exceptional 5.0% |
| Brazilians | 97.4 /100 | #111 | Exceptional 5.0% |
| Taiwanese | 97.3 /100 | #112 | Exceptional 5.0% |
| Immigrants | Pakistan | 97.2 /100 | #113 | Exceptional 5.0% |
| Immigrants | Morocco | 96.8 /100 | #114 | Exceptional 5.0% |
| Moroccans | 96.8 /100 | #115 | Exceptional 5.0% |
| Venezuelans | 96.3 /100 | #116 | Exceptional 4.9% |
| Immigrants | Syria | 96.0 /100 | #117 | Exceptional 4.9% |
| Croatians | 96.0 /100 | #118 | Exceptional 4.9% |
| Immigrants | Sudan | 95.4 /100 | #119 | Exceptional 4.9% |
| Albanians | 95.3 /100 | #120 | Exceptional 4.9% |
| Immigrants | Moldova | 94.8 /100 | #121 | Exceptional 4.9% |
| Immigrants | Germany | 94.1 /100 | #122 | Exceptional 4.9% |
Demographics Similar to Immigrants from Zimbabwe by Professional Degree
In terms of professional degree, the demographic groups most similar to Immigrants from Zimbabwe are Greek (5.3%, a difference of 0.0%), Carpatho Rusyn (5.3%, a difference of 0.020%), Immigrants from Croatia (5.3%, a difference of 0.020%), Immigrants from Chile (5.3%, a difference of 0.11%), and Romanian (5.3%, a difference of 0.22%).
| Demographics | Rating | Rank | Professional Degree |
| Armenians | 99.7 /100 | #78 | Exceptional 5.3% |
| Immigrants | North America | 99.7 /100 | #79 | Exceptional 5.3% |
| Immigrants | England | 99.6 /100 | #80 | Exceptional 5.3% |
| Immigrants | Brazil | 99.6 /100 | #81 | Exceptional 5.3% |
| Romanians | 99.6 /100 | #82 | Exceptional 5.3% |
| Carpatho Rusyns | 99.6 /100 | #83 | Exceptional 5.3% |
| Immigrants | Croatia | 99.6 /100 | #84 | Exceptional 5.3% |
| Immigrants | Zimbabwe | 99.6 /100 | #85 | Exceptional 5.3% |
| Greeks | 99.6 /100 | #86 | Exceptional 5.3% |
| Immigrants | Chile | 99.5 /100 | #87 | Exceptional 5.3% |
| Egyptians | 99.5 /100 | #88 | Exceptional 5.3% |
| Chileans | 99.5 /100 | #89 | Exceptional 5.3% |
| Immigrants | Scotland | 99.5 /100 | #90 | Exceptional 5.3% |
| Laotians | 99.5 /100 | #91 | Exceptional 5.2% |
| Immigrants | Eastern Europe | 99.5 /100 | #92 | Exceptional 5.2% |