Moroccan vs Choctaw Professional Degree
COMPARE
Moroccan
Choctaw
Professional Degree
Professional Degree Comparison
Moroccans
Choctaw
5.0%
PROFESSIONAL DEGREE
96.8/ 100
METRIC RATING
115th/ 347
METRIC RANK
3.2%
PROFESSIONAL DEGREE
0.1/ 100
METRIC RATING
319th/ 347
METRIC RANK
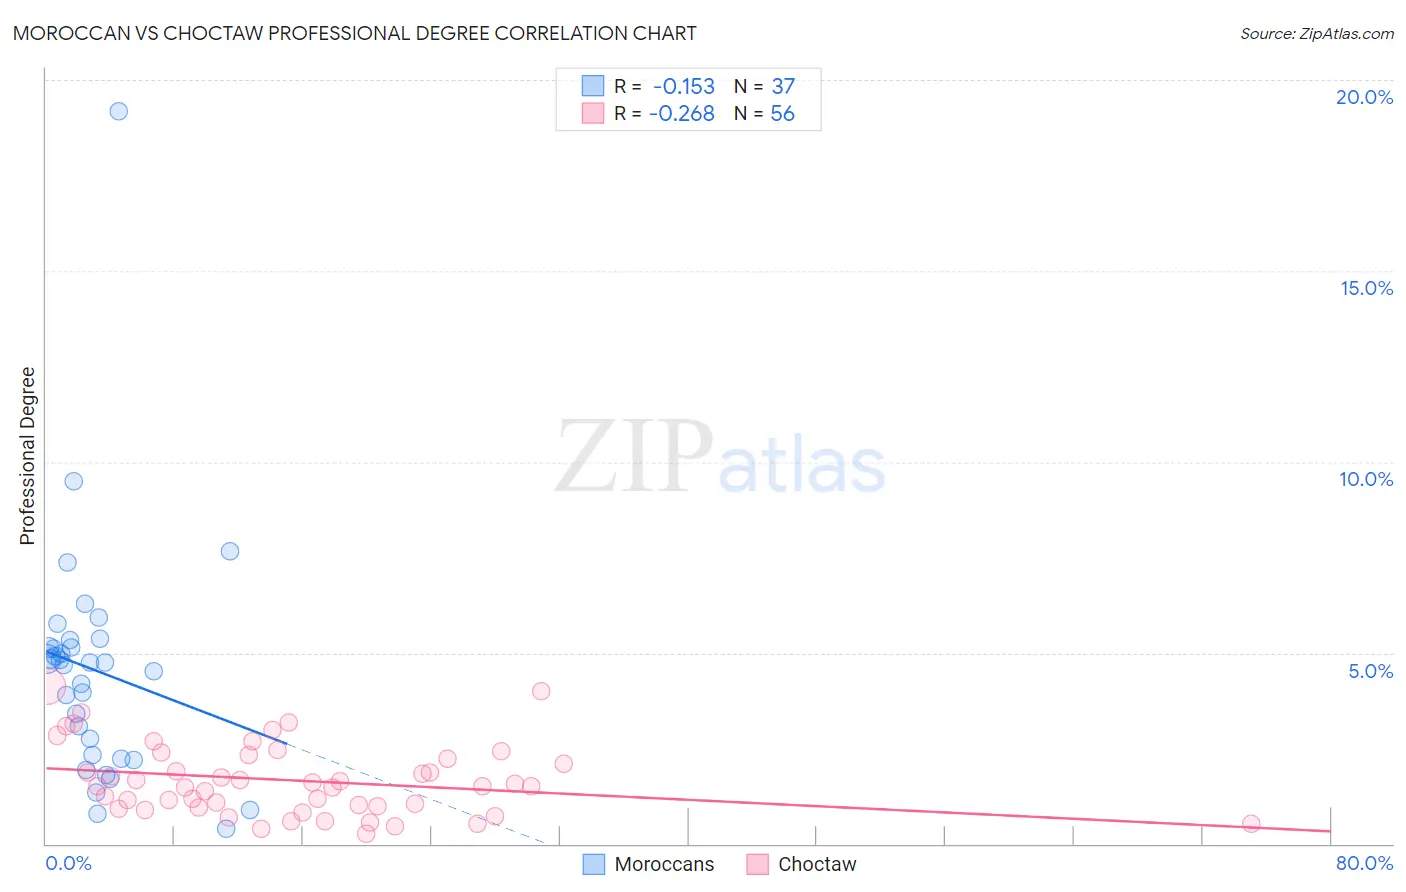
Moroccan vs Choctaw Professional Degree Correlation Chart
The statistical analysis conducted on geographies consisting of 201,703,459 people shows a poor negative correlation between the proportion of Moroccans and percentage of population with at least professional degree education in the United States with a correlation coefficient (R) of -0.153 and weighted average of 5.0%. Similarly, the statistical analysis conducted on geographies consisting of 268,673,582 people shows a weak negative correlation between the proportion of Choctaw and percentage of population with at least professional degree education in the United States with a correlation coefficient (R) of -0.268 and weighted average of 3.2%, a difference of 53.3%.
Professional Degree Correlation Summary
| Measurement | Moroccan | Choctaw |
| Minimum | 0.40% | 0.25% |
| Maximum | 19.2% | 4.1% |
| Range | 18.8% | 3.9% |
| Mean | 4.5% | 1.7% |
| Median | 4.7% | 1.5% |
| Interquartile 25% (IQ1) | 2.3% | 0.97% |
| Interquartile 75% (IQ3) | 5.2% | 2.3% |
| Interquartile Range (IQR) | 3.0% | 1.3% |
| Standard Deviation (Sample) | 3.2% | 0.93% |
| Standard Deviation (Population) | 3.1% | 0.92% |
Similar Demographics by Professional Degree
Demographics Similar to Moroccans by Professional Degree
In terms of professional degree, the demographic groups most similar to Moroccans are Immigrants from Morocco (5.0%, a difference of 0.10%), Venezuelan (4.9%, a difference of 0.47%), Immigrants from Pakistan (5.0%, a difference of 0.55%), Taiwanese (5.0%, a difference of 0.57%), and Immigrants from Syria (4.9%, a difference of 0.68%).
| Demographics | Rating | Rank | Professional Degree |
| Immigrants | Southern Europe | 98.1 /100 | #108 | Exceptional 5.0% |
| British | 98.0 /100 | #109 | Exceptional 5.0% |
| Lebanese | 98.0 /100 | #110 | Exceptional 5.0% |
| Brazilians | 97.4 /100 | #111 | Exceptional 5.0% |
| Taiwanese | 97.3 /100 | #112 | Exceptional 5.0% |
| Immigrants | Pakistan | 97.2 /100 | #113 | Exceptional 5.0% |
| Immigrants | Morocco | 96.8 /100 | #114 | Exceptional 5.0% |
| Moroccans | 96.8 /100 | #115 | Exceptional 5.0% |
| Venezuelans | 96.3 /100 | #116 | Exceptional 4.9% |
| Immigrants | Syria | 96.0 /100 | #117 | Exceptional 4.9% |
| Croatians | 96.0 /100 | #118 | Exceptional 4.9% |
| Immigrants | Sudan | 95.4 /100 | #119 | Exceptional 4.9% |
| Albanians | 95.3 /100 | #120 | Exceptional 4.9% |
| Immigrants | Moldova | 94.8 /100 | #121 | Exceptional 4.9% |
| Immigrants | Germany | 94.1 /100 | #122 | Exceptional 4.9% |
Demographics Similar to Choctaw by Professional Degree
In terms of professional degree, the demographic groups most similar to Choctaw are Immigrants from Micronesia (3.2%, a difference of 0.24%), Nepalese (3.2%, a difference of 0.27%), Puerto Rican (3.2%, a difference of 0.48%), Immigrants from Laos (3.2%, a difference of 0.50%), and Seminole (3.2%, a difference of 1.1%).
| Demographics | Rating | Rank | Professional Degree |
| Sioux | 0.1 /100 | #312 | Tragic 3.3% |
| Yuman | 0.1 /100 | #313 | Tragic 3.3% |
| Mexican American Indians | 0.1 /100 | #314 | Tragic 3.3% |
| Immigrants | Laos | 0.1 /100 | #315 | Tragic 3.2% |
| Puerto Ricans | 0.1 /100 | #316 | Tragic 3.2% |
| Nepalese | 0.1 /100 | #317 | Tragic 3.2% |
| Immigrants | Micronesia | 0.1 /100 | #318 | Tragic 3.2% |
| Choctaw | 0.1 /100 | #319 | Tragic 3.2% |
| Seminole | 0.1 /100 | #320 | Tragic 3.2% |
| Tsimshian | 0.0 /100 | #321 | Tragic 3.2% |
| Hispanics or Latinos | 0.0 /100 | #322 | Tragic 3.2% |
| Inupiat | 0.0 /100 | #323 | Tragic 3.2% |
| Crow | 0.0 /100 | #324 | Tragic 3.2% |
| Yaqui | 0.0 /100 | #325 | Tragic 3.2% |
| Menominee | 0.0 /100 | #326 | Tragic 3.1% |