Moroccan vs Immigrants from Bangladesh Professional Degree

COMPARE

Moroccan
Race
Ancestry
AfghanAfricanAlaska NativeAlaskan AthabascanAlbanianAleutAlsatianAmericanApacheArabArapahoArgentineanArmenianAssyrian/Chaldean/SyriacAustralianAustrianBahamianBangladeshiBarbadianBasqueBelgianBelizeanBermudanBhutaneseBlackfeetBolivianBrazilianBritishBritish West IndianBulgarianBurmeseCajunCambodianCanadianCape VerdeanCarpatho RusynCelticCentral AmericanCentral American IndianCherokeeCheyenneChickasawChileanChineseChippewaChoctawColombianColvilleComancheCosta RicanCreeCreekCroatianCrowCubanCypriotCzechCzechoslovakianDanishDelawareDominicanDutchDutch West IndianEastern EuropeanEcuadorianEgyptianEnglishEstonianEthiopianEuropeanFijianFilipinoFinnishFrenchFrench American IndianFrench CanadianGermanGerman RussianGhanaianGreekGuamanian/ChamorroGuatemalanGuyaneseHaitianHmongHonduranHopiHoumaHungarianIcelanderIndian (Asian)IndonesianInupiatIranianIraqiIrishIroquoisIsraeliItalianJamaicanJapaneseJordanianKenyanKiowaKoreanLaotianLatvianLebaneseLiberianLithuanianLumbeeLuxembourgerMacedonianMalaysianMalteseMarshalleseMenomineeMexicanMexican American IndianMongolianMoroccanNative HawaiianNavajoNepaleseNew ZealanderNicaraguanNigerianNorthern EuropeanNorwegianOkinawanOsageOttawaPaiutePakistaniPalestinianPanamanianParaguayanPennsylvania GermanPeruvianPimaPolishPortuguesePotawatomiPuebloPuerto RicanPuget Sound SalishRomanianRussianSalvadoranSamoanScandinavianScotch-IrishScottishSeminoleSenegaleseSerbianShoshoneSierra LeoneanSiouxSlavicSlovakSloveneSomaliSouth AfricanSouth AmericanSouth American IndianSoviet UnionSpaniardSpanishSpanish AmericanSpanish American IndianSri LankanSubsaharan AfricanSudaneseSwedishSwissSyrianTaiwaneseThaiTlingit-HaidaTohono O'OdhamTonganTrinidadian and TobagonianTsimshianTurkishU.S. Virgin IslanderUgandanUkrainianUruguayanUteVenezuelanVietnameseWelshWest IndianYakamaYaquiYugoslavianYumanYup'ikZimbabwean
Immigration
NonimmigrantsImmigrantsAfghanistanAfricaAlbaniaArgentinaArmeniaAsiaAustraliaAustriaBahamasBarbadosBelarusBelgiumBelizeBoliviaBosnia and HerzegovinaBrazilBulgariaBurma/MyanmarCabo VerdeCambodiaCameroonCanadaCaribbeanCentral AmericaChileChinaColombiaCongoCosta RicaCroatiaCubaCzechoslovakiaDenmarkDominicaDominican RepublicEastern AfricaEastern AsiaEastern EuropeEcuadorEgyptEl SalvadorEnglandEritreaEthiopiaEuropeFijiFranceGermanyGhanaGreeceGrenadaGuatemalaGuyanaHaitiHondurasHong KongHungaryIndiaIndonesiaIranIraqIrelandIsraelItalyJamaicaJapanJordanKazakhstanKenyaKoreaKuwaitLaosLatin AmericaLatviaLebanonLiberiaLithuaniaMalaysiaMexicoMicronesiaMiddle AfricaMoldovaMoroccoNepalNetherlandsNicaraguaNigeriaNorth AmericaNorth MacedoniaNorthern AfricaNorthern EuropeNorwayOceaniaPakistanPanamaPeruPhilippinesPolandPortugalRomaniaRussiaSaudi ArabiaScotlandSenegalSerbiaSierra LeoneSingaporeSomaliaSouth AfricaSouth AmericaSouth Central AsiaSouth Eastern AsiaSouthern EuropeSpainSri LankaSt. Vincent and the GrenadinesSudanSwedenSwitzerlandSyriaTaiwanThailandTrinidad and TobagoTurkeyUgandaUkraineUruguayUzbekistanVenezuelaVietnamWest IndiesWestern AfricaWestern AsiaWestern EuropeYemenZaireZimbabweAzores
Immigrants from Bangladesh
Race
Ancestry
AfghanAfricanAlaska NativeAlaskan AthabascanAlbanianAleutAlsatianAmericanApacheArabArapahoArgentineanArmenianAssyrian/Chaldean/SyriacAustralianAustrianBahamianBangladeshiBarbadianBasqueBelgianBelizeanBermudanBhutaneseBlackfeetBolivianBrazilianBritishBritish West IndianBulgarianBurmeseCajunCambodianCanadianCape VerdeanCarpatho RusynCelticCentral AmericanCentral American IndianCherokeeCheyenneChickasawChileanChineseChippewaChoctawColombianColvilleComancheCosta RicanCreeCreekCroatianCrowCubanCypriotCzechCzechoslovakianDanishDelawareDominicanDutchDutch West IndianEastern EuropeanEcuadorianEgyptianEnglishEstonianEthiopianEuropeanFijianFilipinoFinnishFrenchFrench American IndianFrench CanadianGermanGerman RussianGhanaianGreekGuamanian/ChamorroGuatemalanGuyaneseHaitianHmongHonduranHopiHoumaHungarianIcelanderIndian (Asian)IndonesianInupiatIranianIraqiIrishIroquoisIsraeliItalianJamaicanJapaneseJordanianKenyanKiowaKoreanLaotianLatvianLebaneseLiberianLithuanianLumbeeLuxembourgerMacedonianMalaysianMalteseMarshalleseMenomineeMexicanMexican American IndianMongolianNative HawaiianNavajoNepaleseNew ZealanderNicaraguanNigerianNorthern EuropeanNorwegianOkinawanOsageOttawaPaiutePakistaniPalestinianPanamanianParaguayanPennsylvania GermanPeruvianPimaPolishPortuguesePotawatomiPuebloPuerto RicanPuget Sound SalishRomanianRussianSalvadoranSamoanScandinavianScotch-IrishScottishSeminoleSenegaleseSerbianShoshoneSierra LeoneanSiouxSlavicSlovakSloveneSomaliSouth AfricanSouth AmericanSouth American IndianSoviet UnionSpaniardSpanishSpanish AmericanSpanish American IndianSri LankanSubsaharan AfricanSudaneseSwedishSwissSyrianTaiwaneseThaiTlingit-HaidaTohono O'OdhamTonganTrinidadian and TobagonianTsimshianTurkishU.S. Virgin IslanderUgandanUkrainianUruguayanUteVenezuelanVietnameseWelshWest IndianYakamaYaquiYugoslavianYumanYup'ikZimbabwean
Immigration
NonimmigrantsImmigrantsAfghanistanAfricaAlbaniaArgentinaArmeniaAsiaAustraliaAustriaBahamasBangladeshBarbadosBelarusBelgiumBelizeBoliviaBosnia and HerzegovinaBrazilBulgariaBurma/MyanmarCabo VerdeCambodiaCameroonCanadaCaribbeanCentral AmericaChileChinaColombiaCongoCosta RicaCroatiaCubaCzechoslovakiaDenmarkDominicaDominican RepublicEastern AfricaEastern AsiaEastern EuropeEcuadorEgyptEl SalvadorEnglandEritreaEthiopiaEuropeFijiFranceGermanyGhanaGreeceGrenadaGuatemalaGuyanaHaitiHondurasHong KongHungaryIndiaIndonesiaIranIraqIrelandIsraelItalyJamaicaJapanJordanKazakhstanKenyaKoreaKuwaitLaosLatin AmericaLatviaLebanonLiberiaLithuaniaMalaysiaMexicoMicronesiaMiddle AfricaMoldovaMoroccoNepalNetherlandsNicaraguaNigeriaNorth AmericaNorth MacedoniaNorthern AfricaNorthern EuropeNorwayOceaniaPakistanPanamaPeruPhilippinesPolandPortugalRomaniaRussiaSaudi ArabiaScotlandSenegalSerbiaSierra LeoneSingaporeSomaliaSouth AfricaSouth AmericaSouth Central AsiaSouth Eastern AsiaSouthern EuropeSpainSri LankaSt. Vincent and the GrenadinesSudanSwedenSwitzerlandSyriaTaiwanThailandTrinidad and TobagoTurkeyUgandaUkraineUruguayUzbekistanVenezuelaVietnamWest IndiesWestern AfricaWestern AsiaWestern EuropeYemenZaireZimbabweAzores
Professional Degree
Income
Poverty
Unemployment
Labor Participation
Family Structure
Vehicle Availability
Education Level
Disability

Professional Degree Comparison

Moroccans

Immigrants from Bangladesh

Exceptional
Average
5.0%
PROFESSIONAL DEGREE
96.8/ 100
METRIC RATING
115th/ 347
METRIC RANK
4.4%
PROFESSIONAL DEGREE
56.0/ 100
METRIC RATING
171st/ 347
METRIC RANK

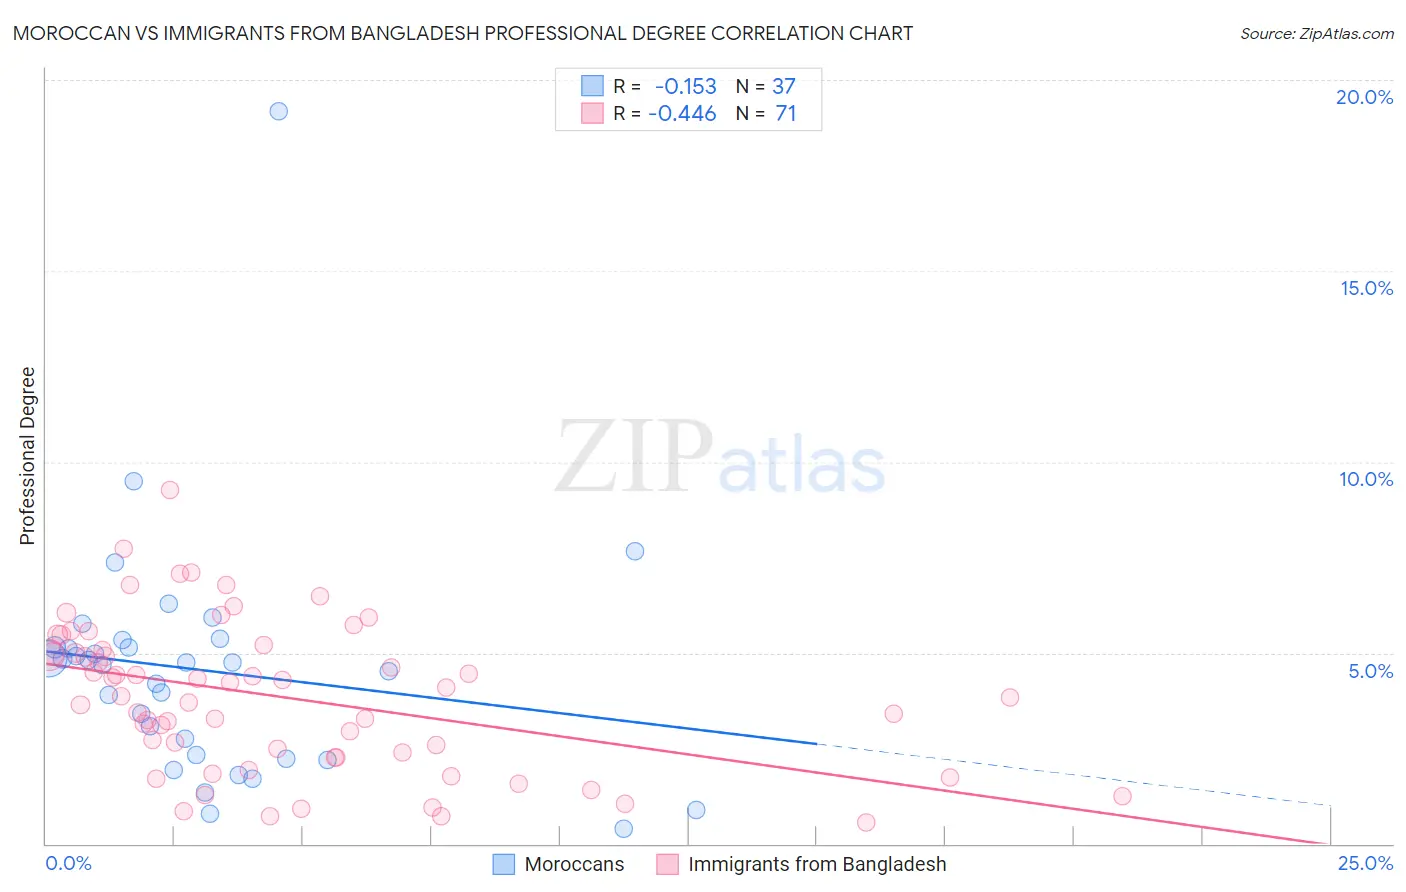
Moroccan vs Immigrants from Bangladesh Professional Degree Correlation Chart

The statistical analysis conducted on geographies consisting of 201,703,459 people shows a poor negative correlation between the proportion of Moroccans and percentage of population with at least professional degree education in the United States with a correlation coefficient (R) of -0.153 and weighted average of 5.0%. Similarly, the statistical analysis conducted on geographies consisting of 203,559,674 people shows a moderate negative correlation between the proportion of Immigrants from Bangladesh and percentage of population with at least professional degree education in the United States with a correlation coefficient (R) of -0.446 and weighted average of 4.4%, a difference of 11.4%.
Moroccan vs Immigrants from Bangladesh Professional Degree

Professional Degree Correlation Summary

MeasurementMoroccanImmigrants from Bangladesh
Minimum0.40%0.56%
Maximum19.2%9.3%
Range18.8%8.7%
Mean4.5%3.8%
Median4.7%3.9%
Interquartile 25% (IQ1)2.3%2.3%
Interquartile 75% (IQ3)5.2%5.1%
Interquartile Range (IQR)3.0%2.8%
Standard Deviation (Sample)3.2%1.9%
Standard Deviation (Population)3.1%1.9%

Similar Demographics by Professional Degree

Demographics Similar to Moroccans by Professional Degree

In terms of professional degree, the demographic groups most similar to Moroccans are Immigrants from Morocco (5.0%, a difference of 0.10%), Venezuelan (4.9%, a difference of 0.47%), Immigrants from Pakistan (5.0%, a difference of 0.55%), Taiwanese (5.0%, a difference of 0.57%), and Immigrants from Syria (4.9%, a difference of 0.68%).
DemographicsRating | RankProfessional Degree
Immigrants | Southern Europe
98.1
/100
|
#108
Exceptional
5.0%
British
98.0
/100
|
#109
Exceptional
5.0%
Lebanese
98.0
/100
|
#110
Exceptional
5.0%
Brazilians
97.4
/100
|
#111
Exceptional
5.0%
Taiwanese
97.3
/100
|
#112
Exceptional
5.0%
Immigrants | Pakistan
97.2
/100
|
#113
Exceptional
5.0%
Immigrants | Morocco
96.8
/100
|
#114
Exceptional
5.0%
Moroccans
96.8
/100
|
#115
Exceptional
5.0%
Venezuelans
96.3
/100
|
#116
Exceptional
4.9%
Immigrants | Syria
96.0
/100
|
#117
Exceptional
4.9%
Croatians
96.0
/100
|
#118
Exceptional
4.9%
Immigrants | Sudan
95.4
/100
|
#119
Exceptional
4.9%
Albanians
95.3
/100
|
#120
Exceptional
4.9%
Immigrants | Moldova
94.8
/100
|
#121
Exceptional
4.9%
Immigrants | Germany
94.1
/100
|
#122
Exceptional
4.9%

Demographics Similar to Immigrants from Bangladesh by Professional Degree

In terms of professional degree, the demographic groups most similar to Immigrants from Bangladesh are Immigrants from Zaire (4.5%, a difference of 0.22%), Chinese (4.5%, a difference of 0.39%), Immigrants from Sierra Leone (4.5%, a difference of 0.41%), Immigrants from Afghanistan (4.5%, a difference of 0.48%), and Immigrants from Colombia (4.5%, a difference of 0.51%).
DemographicsRating | RankProfessional Degree
Swiss
61.0
/100
|
#164
Good
4.5%
Costa Ricans
59.9
/100
|
#165
Average
4.5%
Immigrants | Colombia
59.4
/100
|
#166
Average
4.5%
Immigrants | Afghanistan
59.2
/100
|
#167
Average
4.5%
Immigrants | Sierra Leone
58.7
/100
|
#168
Average
4.5%
Chinese
58.6
/100
|
#169
Average
4.5%
Immigrants | Zaire
57.4
/100
|
#170
Average
4.5%
Immigrants | Bangladesh
56.0
/100
|
#171
Average
4.4%
Spaniards
52.0
/100
|
#172
Average
4.4%
English
50.1
/100
|
#173
Average
4.4%
Kenyans
50.0
/100
|
#174
Average
4.4%
Irish
50.0
/100
|
#175
Average
4.4%
Immigrants | Peru
49.3
/100
|
#176
Average
4.4%
Celtics
47.6
/100
|
#177
Average
4.4%
Immigrants | Costa Rica
46.7
/100
|
#178
Average
4.4%