South African vs Immigrants from Uganda 4th Grade
COMPARE
South African
Immigrants from Uganda
4th Grade
4th Grade Comparison
South Africans
Immigrants from Uganda
97.9%
4TH GRADE
98.2/ 100
METRIC RATING
98th/ 347
METRIC RANK
97.4%
4TH GRADE
19.8/ 100
METRIC RATING
200th/ 347
METRIC RANK
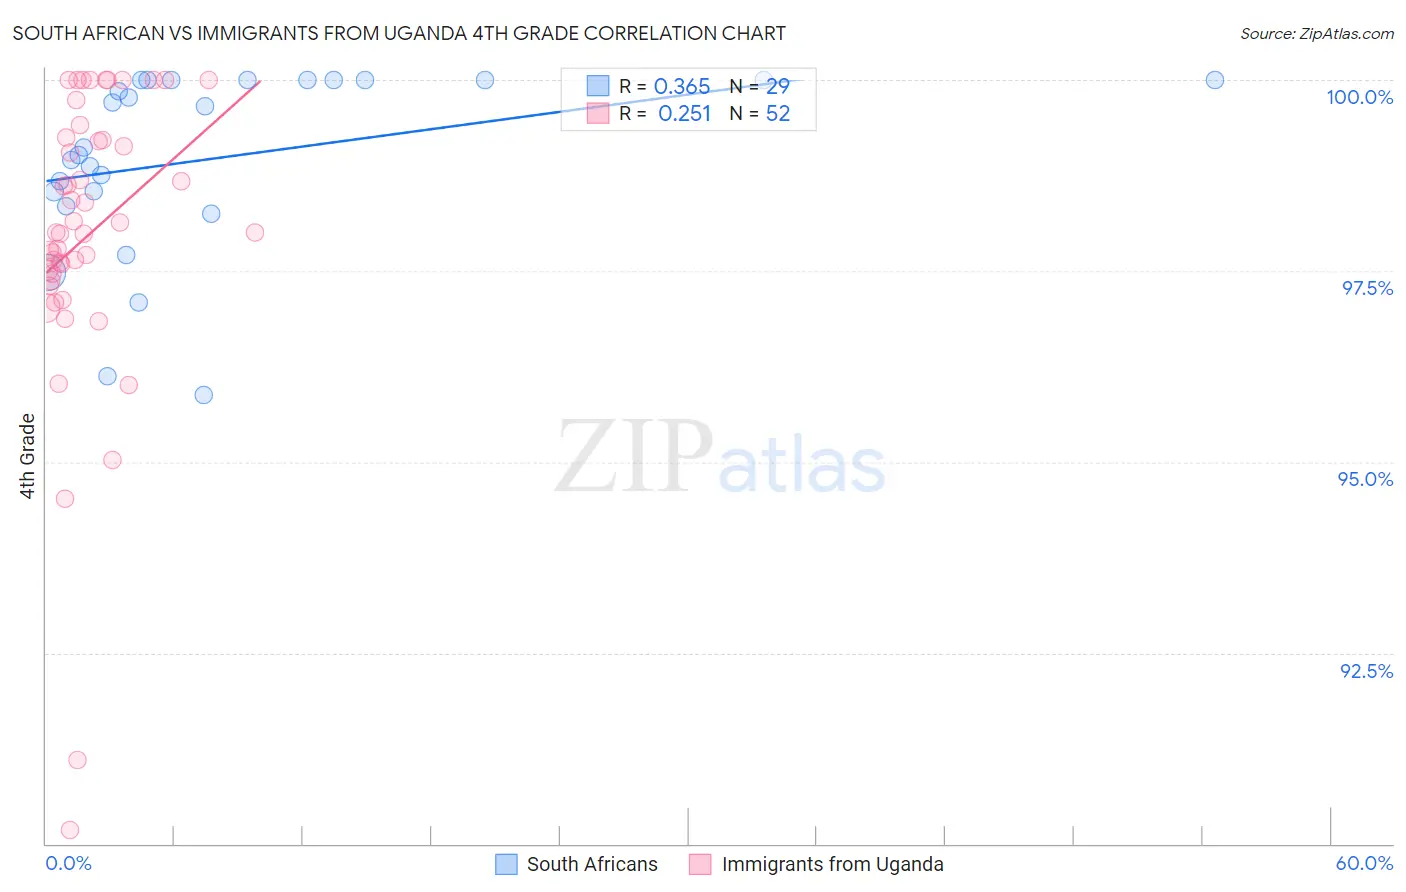
South African vs Immigrants from Uganda 4th Grade Correlation Chart
The statistical analysis conducted on geographies consisting of 182,604,532 people shows a mild positive correlation between the proportion of South Africans and percentage of population with at least 4th grade education in the United States with a correlation coefficient (R) of 0.365 and weighted average of 97.9%. Similarly, the statistical analysis conducted on geographies consisting of 125,941,298 people shows a weak positive correlation between the proportion of Immigrants from Uganda and percentage of population with at least 4th grade education in the United States with a correlation coefficient (R) of 0.251 and weighted average of 97.4%, a difference of 0.51%.
4th Grade Correlation Summary
| Measurement | South African | Immigrants from Uganda |
| Minimum | 95.9% | 90.2% |
| Maximum | 100.0% | 100.0% |
| Range | 4.1% | 9.8% |
| Mean | 99.0% | 98.0% |
| Median | 99.1% | 98.0% |
| Interquartile 25% (IQ1) | 98.4% | 97.4% |
| Interquartile 75% (IQ3) | 100.0% | 99.2% |
| Interquartile Range (IQR) | 1.6% | 1.8% |
| Standard Deviation (Sample) | 1.2% | 2.0% |
| Standard Deviation (Population) | 1.2% | 2.0% |
Similar Demographics by 4th Grade
Demographics Similar to South Africans by 4th Grade
In terms of 4th grade, the demographic groups most similar to South Africans are Turkish (97.9%, a difference of 0.0%), Romanian (97.9%, a difference of 0.010%), Cheyenne (97.9%, a difference of 0.010%), Yugoslavian (97.9%, a difference of 0.010%), and Cree (97.9%, a difference of 0.010%).
| Demographics | Rating | Rank | 4th Grade |
| Immigrants | Sweden | 98.7 /100 | #91 | Exceptional 97.9% |
| Immigrants | Western Europe | 98.7 /100 | #92 | Exceptional 97.9% |
| Immigrants | Ireland | 98.7 /100 | #93 | Exceptional 97.9% |
| Shoshone | 98.7 /100 | #94 | Exceptional 97.9% |
| Immigrants | Germany | 98.5 /100 | #95 | Exceptional 97.9% |
| Romanians | 98.4 /100 | #96 | Exceptional 97.9% |
| Cheyenne | 98.4 /100 | #97 | Exceptional 97.9% |
| South Africans | 98.2 /100 | #98 | Exceptional 97.9% |
| Turks | 98.2 /100 | #99 | Exceptional 97.9% |
| Yugoslavians | 98.1 /100 | #100 | Exceptional 97.9% |
| Cree | 98.1 /100 | #101 | Exceptional 97.9% |
| Choctaw | 97.9 /100 | #102 | Exceptional 97.9% |
| Puget Sound Salish | 97.7 /100 | #103 | Exceptional 97.9% |
| Immigrants | Nonimmigrants | 97.5 /100 | #104 | Exceptional 97.9% |
| German Russians | 97.5 /100 | #105 | Exceptional 97.9% |
Demographics Similar to Immigrants from Uganda by 4th Grade
In terms of 4th grade, the demographic groups most similar to Immigrants from Uganda are Native/Alaskan (97.4%, a difference of 0.010%), Guamanian/Chamorro (97.4%, a difference of 0.020%), Immigrants from Southern Europe (97.4%, a difference of 0.020%), Immigrants from Chile (97.4%, a difference of 0.020%), and Hawaiian (97.4%, a difference of 0.030%).
| Demographics | Rating | Rank | 4th Grade |
| Immigrants | Egypt | 30.1 /100 | #193 | Fair 97.4% |
| Portuguese | 29.2 /100 | #194 | Fair 97.4% |
| Paraguayans | 28.9 /100 | #195 | Fair 97.4% |
| Immigrants | Albania | 27.7 /100 | #196 | Fair 97.4% |
| Hawaiians | 25.6 /100 | #197 | Fair 97.4% |
| Guamanians/Chamorros | 23.0 /100 | #198 | Fair 97.4% |
| Natives/Alaskans | 20.6 /100 | #199 | Fair 97.4% |
| Immigrants | Uganda | 19.8 /100 | #200 | Poor 97.4% |
| Immigrants | Southern Europe | 16.2 /100 | #201 | Poor 97.4% |
| Immigrants | Chile | 16.1 /100 | #202 | Poor 97.4% |
| Immigrants | Northern Africa | 15.1 /100 | #203 | Poor 97.4% |
| Africans | 14.6 /100 | #204 | Poor 97.4% |
| Paiute | 13.2 /100 | #205 | Poor 97.3% |
| Immigrants | Zaire | 12.8 /100 | #206 | Poor 97.3% |
| Moroccans | 11.3 /100 | #207 | Poor 97.3% |