Mongolian vs Sudanese Associate's Degree
COMPARE
Mongolian
Sudanese
Associate's Degree
Associate's Degree Comparison
Mongolians
Sudanese
53.0%
ASSOCIATE'S DEGREE
100.0/ 100
METRIC RATING
38th/ 347
METRIC RANK
47.1%
ASSOCIATE'S DEGREE
70.3/ 100
METRIC RATING
157th/ 347
METRIC RANK
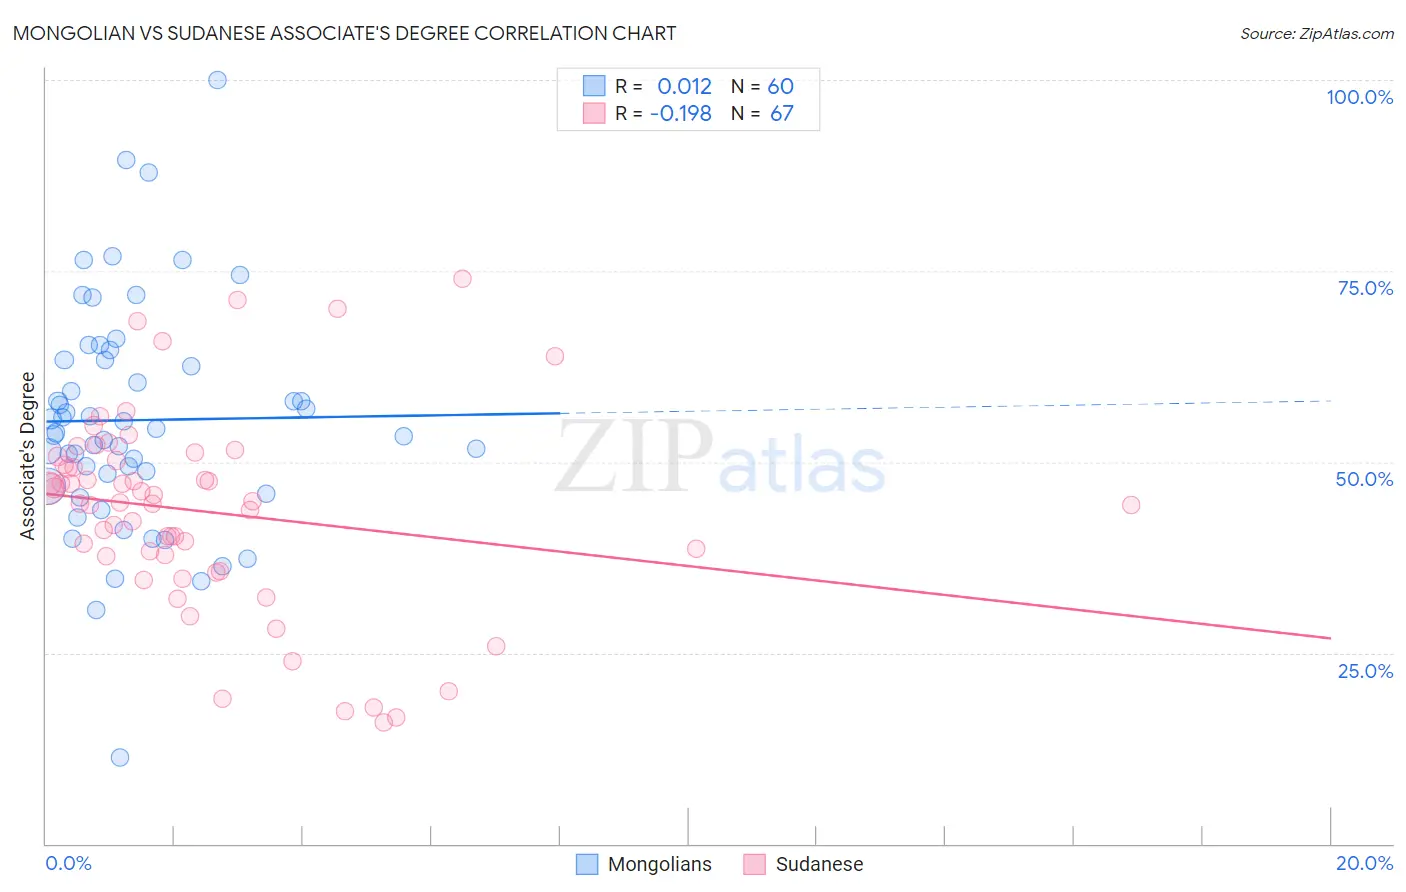
Mongolian vs Sudanese Associate's Degree Correlation Chart
The statistical analysis conducted on geographies consisting of 140,359,763 people shows no correlation between the proportion of Mongolians and percentage of population with at least associate's degree education in the United States with a correlation coefficient (R) of 0.012 and weighted average of 53.0%. Similarly, the statistical analysis conducted on geographies consisting of 110,144,981 people shows a poor negative correlation between the proportion of Sudanese and percentage of population with at least associate's degree education in the United States with a correlation coefficient (R) of -0.198 and weighted average of 47.1%, a difference of 12.5%.
Associate's Degree Correlation Summary
| Measurement | Mongolian | Sudanese |
| Minimum | 11.2% | 15.8% |
| Maximum | 100.0% | 74.0% |
| Range | 88.8% | 58.2% |
| Mean | 55.5% | 43.5% |
| Median | 54.1% | 44.6% |
| Interquartile 25% (IQ1) | 47.6% | 37.6% |
| Interquartile 75% (IQ3) | 63.3% | 50.2% |
| Interquartile Range (IQR) | 15.7% | 12.6% |
| Standard Deviation (Sample) | 15.0% | 12.9% |
| Standard Deviation (Population) | 14.9% | 12.8% |
Similar Demographics by Associate's Degree
Demographics Similar to Mongolians by Associate's Degree
In terms of associate's degree, the demographic groups most similar to Mongolians are Immigrants from Denmark (53.1%, a difference of 0.16%), Immigrants from Russia (53.1%, a difference of 0.25%), Immigrants from Belarus (52.8%, a difference of 0.29%), Immigrants from Latvia (52.8%, a difference of 0.36%), and Russian (53.2%, a difference of 0.53%).
| Demographics | Rating | Rank | Associate's Degree |
| Immigrants | Northern Europe | 100.0 /100 | #31 | Exceptional 53.5% |
| Immigrants | Turkey | 100.0 /100 | #32 | Exceptional 53.4% |
| Israelis | 100.0 /100 | #33 | Exceptional 53.4% |
| Bulgarians | 100.0 /100 | #34 | Exceptional 53.3% |
| Russians | 100.0 /100 | #35 | Exceptional 53.2% |
| Immigrants | Russia | 100.0 /100 | #36 | Exceptional 53.1% |
| Immigrants | Denmark | 100.0 /100 | #37 | Exceptional 53.1% |
| Mongolians | 100.0 /100 | #38 | Exceptional 53.0% |
| Immigrants | Belarus | 99.9 /100 | #39 | Exceptional 52.8% |
| Immigrants | Latvia | 99.9 /100 | #40 | Exceptional 52.8% |
| Immigrants | Saudi Arabia | 99.9 /100 | #41 | Exceptional 52.6% |
| Immigrants | Malaysia | 99.9 /100 | #42 | Exceptional 52.5% |
| Immigrants | South Africa | 99.9 /100 | #43 | Exceptional 52.5% |
| Estonians | 99.9 /100 | #44 | Exceptional 52.5% |
| Immigrants | Lithuania | 99.9 /100 | #45 | Exceptional 52.4% |
Demographics Similar to Sudanese by Associate's Degree
In terms of associate's degree, the demographic groups most similar to Sudanese are South American (47.1%, a difference of 0.020%), Kenyan (47.1%, a difference of 0.030%), Immigrants from Germany (47.1%, a difference of 0.040%), Immigrants from Poland (47.1%, a difference of 0.090%), and Immigrants from Kenya (47.2%, a difference of 0.16%).
| Demographics | Rating | Rank | Associate's Degree |
| Iraqis | 76.2 /100 | #150 | Good 47.4% |
| Immigrants | North Macedonia | 76.0 /100 | #151 | Good 47.4% |
| Immigrants | Afghanistan | 74.3 /100 | #152 | Good 47.3% |
| Czechs | 72.2 /100 | #153 | Good 47.2% |
| Immigrants | Kenya | 72.1 /100 | #154 | Good 47.2% |
| Kenyans | 70.6 /100 | #155 | Good 47.1% |
| South Americans | 70.5 /100 | #156 | Good 47.1% |
| Sudanese | 70.3 /100 | #157 | Good 47.1% |
| Immigrants | Germany | 69.7 /100 | #158 | Good 47.1% |
| Immigrants | Poland | 69.2 /100 | #159 | Good 47.1% |
| Scottish | 65.4 /100 | #160 | Good 46.9% |
| Scandinavians | 65.2 /100 | #161 | Good 46.9% |
| Immigrants | Africa | 63.2 /100 | #162 | Good 46.8% |
| Somalis | 62.5 /100 | #163 | Good 46.8% |
| Colombians | 62.4 /100 | #164 | Good 46.8% |