Mongolian vs Puerto Rican Associate's Degree
COMPARE
Mongolian
Puerto Rican
Associate's Degree
Associate's Degree Comparison
Mongolians
Puerto Ricans
53.0%
ASSOCIATE'S DEGREE
100.0/ 100
METRIC RATING
38th/ 347
METRIC RANK
40.4%
ASSOCIATE'S DEGREE
0.1/ 100
METRIC RATING
276th/ 347
METRIC RANK
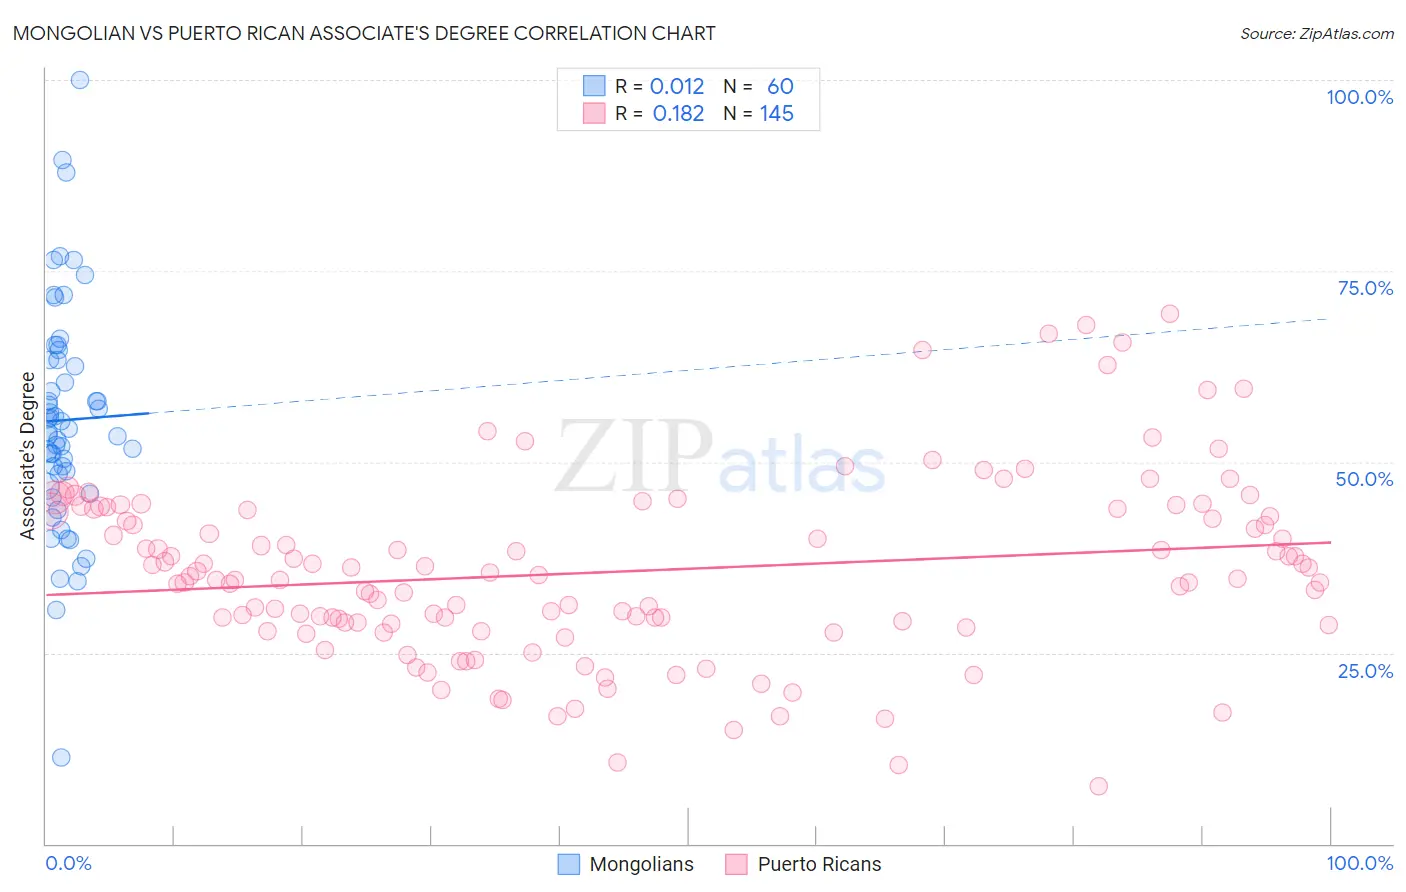
Mongolian vs Puerto Rican Associate's Degree Correlation Chart
The statistical analysis conducted on geographies consisting of 140,359,763 people shows no correlation between the proportion of Mongolians and percentage of population with at least associate's degree education in the United States with a correlation coefficient (R) of 0.012 and weighted average of 53.0%. Similarly, the statistical analysis conducted on geographies consisting of 528,257,777 people shows a poor positive correlation between the proportion of Puerto Ricans and percentage of population with at least associate's degree education in the United States with a correlation coefficient (R) of 0.182 and weighted average of 40.4%, a difference of 31.2%.
Associate's Degree Correlation Summary
| Measurement | Mongolian | Puerto Rican |
| Minimum | 11.2% | 7.5% |
| Maximum | 100.0% | 69.5% |
| Range | 88.8% | 61.9% |
| Mean | 55.5% | 35.6% |
| Median | 54.1% | 34.6% |
| Interquartile 25% (IQ1) | 47.6% | 28.7% |
| Interquartile 75% (IQ3) | 63.3% | 43.8% |
| Interquartile Range (IQR) | 15.7% | 15.1% |
| Standard Deviation (Sample) | 15.0% | 11.8% |
| Standard Deviation (Population) | 14.9% | 11.8% |
Similar Demographics by Associate's Degree
Demographics Similar to Mongolians by Associate's Degree
In terms of associate's degree, the demographic groups most similar to Mongolians are Immigrants from Denmark (53.1%, a difference of 0.16%), Immigrants from Russia (53.1%, a difference of 0.25%), Immigrants from Belarus (52.8%, a difference of 0.29%), Immigrants from Latvia (52.8%, a difference of 0.36%), and Russian (53.2%, a difference of 0.53%).
| Demographics | Rating | Rank | Associate's Degree |
| Immigrants | Northern Europe | 100.0 /100 | #31 | Exceptional 53.5% |
| Immigrants | Turkey | 100.0 /100 | #32 | Exceptional 53.4% |
| Israelis | 100.0 /100 | #33 | Exceptional 53.4% |
| Bulgarians | 100.0 /100 | #34 | Exceptional 53.3% |
| Russians | 100.0 /100 | #35 | Exceptional 53.2% |
| Immigrants | Russia | 100.0 /100 | #36 | Exceptional 53.1% |
| Immigrants | Denmark | 100.0 /100 | #37 | Exceptional 53.1% |
| Mongolians | 100.0 /100 | #38 | Exceptional 53.0% |
| Immigrants | Belarus | 99.9 /100 | #39 | Exceptional 52.8% |
| Immigrants | Latvia | 99.9 /100 | #40 | Exceptional 52.8% |
| Immigrants | Saudi Arabia | 99.9 /100 | #41 | Exceptional 52.6% |
| Immigrants | Malaysia | 99.9 /100 | #42 | Exceptional 52.5% |
| Immigrants | South Africa | 99.9 /100 | #43 | Exceptional 52.5% |
| Estonians | 99.9 /100 | #44 | Exceptional 52.5% |
| Immigrants | Lithuania | 99.9 /100 | #45 | Exceptional 52.4% |
Demographics Similar to Puerto Ricans by Associate's Degree
In terms of associate's degree, the demographic groups most similar to Puerto Ricans are Blackfeet (40.3%, a difference of 0.050%), Potawatomi (40.4%, a difference of 0.10%), Ottawa (40.3%, a difference of 0.20%), Immigrants from Nicaragua (40.3%, a difference of 0.24%), and Immigrants from Dominica (40.5%, a difference of 0.25%).
| Demographics | Rating | Rank | Associate's Degree |
| Americans | 0.2 /100 | #269 | Tragic 40.8% |
| Chippewa | 0.2 /100 | #270 | Tragic 40.7% |
| Immigrants | Laos | 0.1 /100 | #271 | Tragic 40.7% |
| Belizeans | 0.1 /100 | #272 | Tragic 40.6% |
| Puget Sound Salish | 0.1 /100 | #273 | Tragic 40.5% |
| Immigrants | Dominica | 0.1 /100 | #274 | Tragic 40.5% |
| Potawatomi | 0.1 /100 | #275 | Tragic 40.4% |
| Puerto Ricans | 0.1 /100 | #276 | Tragic 40.4% |
| Blackfeet | 0.1 /100 | #277 | Tragic 40.3% |
| Ottawa | 0.1 /100 | #278 | Tragic 40.3% |
| Immigrants | Nicaragua | 0.1 /100 | #279 | Tragic 40.3% |
| Immigrants | Micronesia | 0.1 /100 | #280 | Tragic 40.2% |
| Immigrants | Portugal | 0.1 /100 | #281 | Tragic 40.1% |
| Bangladeshis | 0.1 /100 | #282 | Tragic 40.0% |
| Haitians | 0.1 /100 | #283 | Tragic 40.0% |