Mongolian vs Delaware Median Male Earnings
COMPARE
Mongolian
Delaware
Median Male Earnings
Median Male Earnings Comparison
Mongolians
Delaware
$60,350
MEDIAN MALE EARNINGS
99.7/ 100
METRIC RATING
71st/ 347
METRIC RANK
$52,412
MEDIAN MALE EARNINGS
11.5/ 100
METRIC RATING
210th/ 347
METRIC RANK
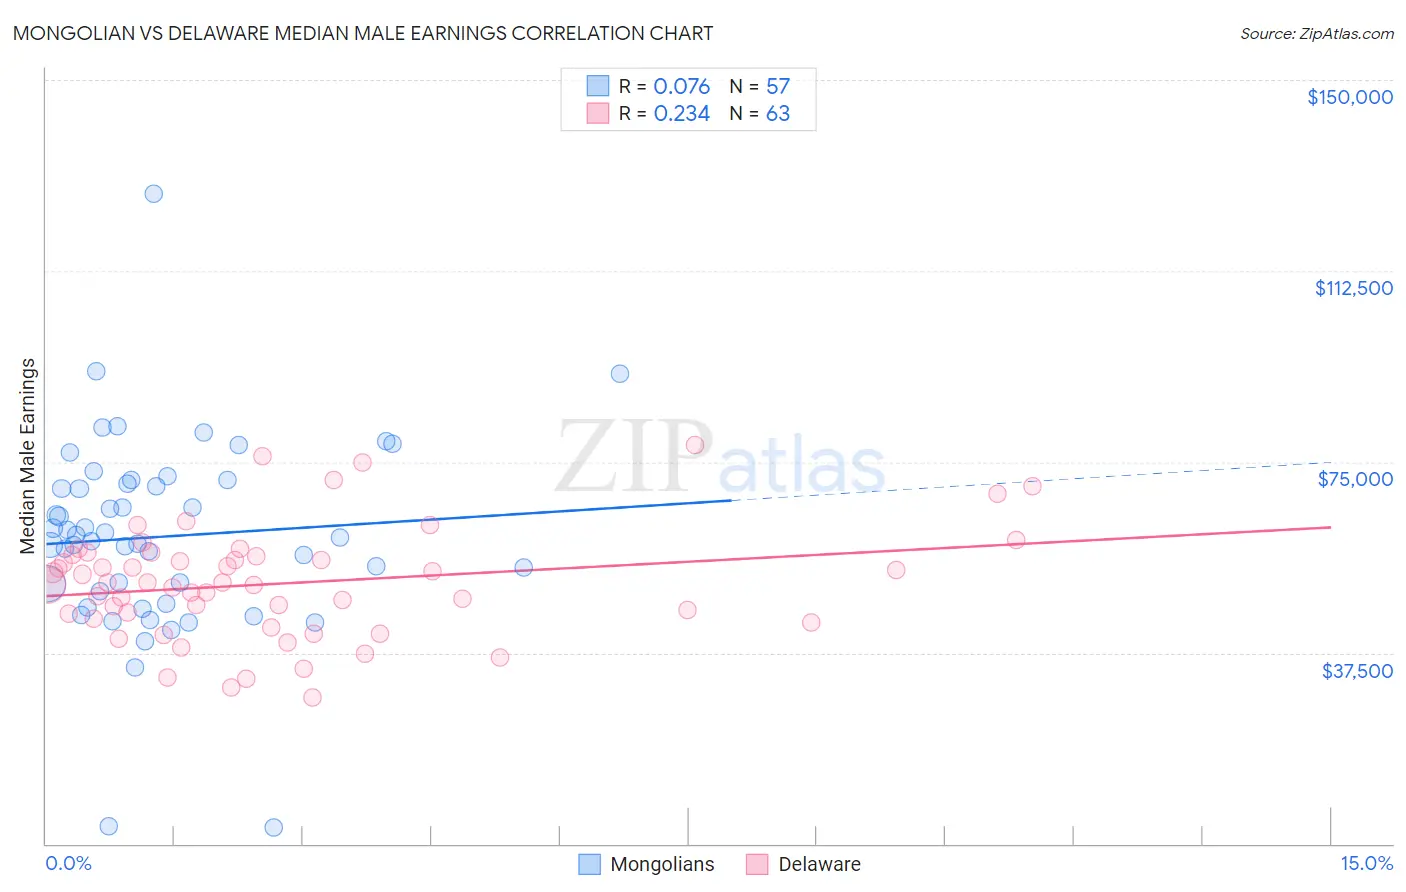
Mongolian vs Delaware Median Male Earnings Correlation Chart
The statistical analysis conducted on geographies consisting of 140,336,104 people shows a slight positive correlation between the proportion of Mongolians and median male earnings in the United States with a correlation coefficient (R) of 0.076 and weighted average of $60,350. Similarly, the statistical analysis conducted on geographies consisting of 96,215,096 people shows a weak positive correlation between the proportion of Delaware and median male earnings in the United States with a correlation coefficient (R) of 0.234 and weighted average of $52,412, a difference of 15.1%.
Median Male Earnings Correlation Summary
| Measurement | Mongolian | Delaware |
| Minimum | $3,109 | $28,768 |
| Maximum | $127,545 | $78,250 |
| Range | $124,436 | $49,482 |
| Mean | $60,323 | $51,144 |
| Median | $60,102 | $51,243 |
| Interquartile 25% (IQ1) | $48,308 | $44,148 |
| Interquartile 75% (IQ3) | $71,104 | $56,755 |
| Interquartile Range (IQR) | $22,796 | $12,606 |
| Standard Deviation (Sample) | $19,294 | $10,850 |
| Standard Deviation (Population) | $19,124 | $10,763 |
Similar Demographics by Median Male Earnings
Demographics Similar to Mongolians by Median Male Earnings
In terms of median male earnings, the demographic groups most similar to Mongolians are Immigrants from Bulgaria ($60,358, a difference of 0.010%), Immigrants from Western Europe ($60,334, a difference of 0.030%), Immigrants from Canada ($60,388, a difference of 0.060%), Immigrants from North America ($60,265, a difference of 0.14%), and Argentinean ($60,117, a difference of 0.39%).
| Demographics | Rating | Rank | Median Male Earnings |
| Immigrants | Eastern Europe | 99.8 /100 | #64 | Exceptional $60,958 |
| Immigrants | Indonesia | 99.8 /100 | #65 | Exceptional $60,935 |
| Immigrants | Croatia | 99.8 /100 | #66 | Exceptional $60,914 |
| Immigrants | Spain | 99.8 /100 | #67 | Exceptional $60,750 |
| Immigrants | Serbia | 99.7 /100 | #68 | Exceptional $60,600 |
| Immigrants | Canada | 99.7 /100 | #69 | Exceptional $60,388 |
| Immigrants | Bulgaria | 99.7 /100 | #70 | Exceptional $60,358 |
| Mongolians | 99.7 /100 | #71 | Exceptional $60,350 |
| Immigrants | Western Europe | 99.7 /100 | #72 | Exceptional $60,334 |
| Immigrants | North America | 99.7 /100 | #73 | Exceptional $60,265 |
| Argentineans | 99.6 /100 | #74 | Exceptional $60,117 |
| Immigrants | Bolivia | 99.6 /100 | #75 | Exceptional $60,088 |
| Romanians | 99.6 /100 | #76 | Exceptional $60,063 |
| Paraguayans | 99.5 /100 | #77 | Exceptional $59,975 |
| Immigrants | Egypt | 99.5 /100 | #78 | Exceptional $59,925 |
Demographics Similar to Delaware by Median Male Earnings
In terms of median male earnings, the demographic groups most similar to Delaware are Tlingit-Haida ($52,409, a difference of 0.010%), Bermudan ($52,465, a difference of 0.10%), Cajun ($52,325, a difference of 0.17%), Venezuelan ($52,510, a difference of 0.19%), and Native Hawaiian ($52,306, a difference of 0.20%).
| Demographics | Rating | Rank | Median Male Earnings |
| Panamanians | 16.5 /100 | #203 | Poor $52,835 |
| Ghanaians | 16.1 /100 | #204 | Poor $52,810 |
| Immigrants | Colombia | 15.0 /100 | #205 | Poor $52,725 |
| Immigrants | Iraq | 14.5 /100 | #206 | Poor $52,681 |
| Vietnamese | 12.7 /100 | #207 | Poor $52,525 |
| Venezuelans | 12.5 /100 | #208 | Poor $52,510 |
| Bermudans | 12.1 /100 | #209 | Poor $52,465 |
| Delaware | 11.5 /100 | #210 | Poor $52,412 |
| Tlingit-Haida | 11.5 /100 | #211 | Poor $52,409 |
| Cajuns | 10.7 /100 | #212 | Poor $52,325 |
| Native Hawaiians | 10.5 /100 | #213 | Poor $52,306 |
| Immigrants | Nonimmigrants | 9.3 /100 | #214 | Tragic $52,170 |
| Immigrants | Cameroon | 8.9 /100 | #215 | Tragic $52,119 |
| Immigrants | Venezuela | 8.3 /100 | #216 | Tragic $52,041 |
| Nigerians | 8.3 /100 | #217 | Tragic $52,039 |