Mexican American Indian vs Soviet Union Associate's Degree
COMPARE
Mexican American Indian
Soviet Union
Associate's Degree
Associate's Degree Comparison
Mexican American Indians
Soviet Union
38.2%
ASSOCIATE'S DEGREE
0.0/ 100
METRIC RATING
308th/ 347
METRIC RANK
55.1%
ASSOCIATE'S DEGREE
100.0/ 100
METRIC RATING
16th/ 347
METRIC RANK
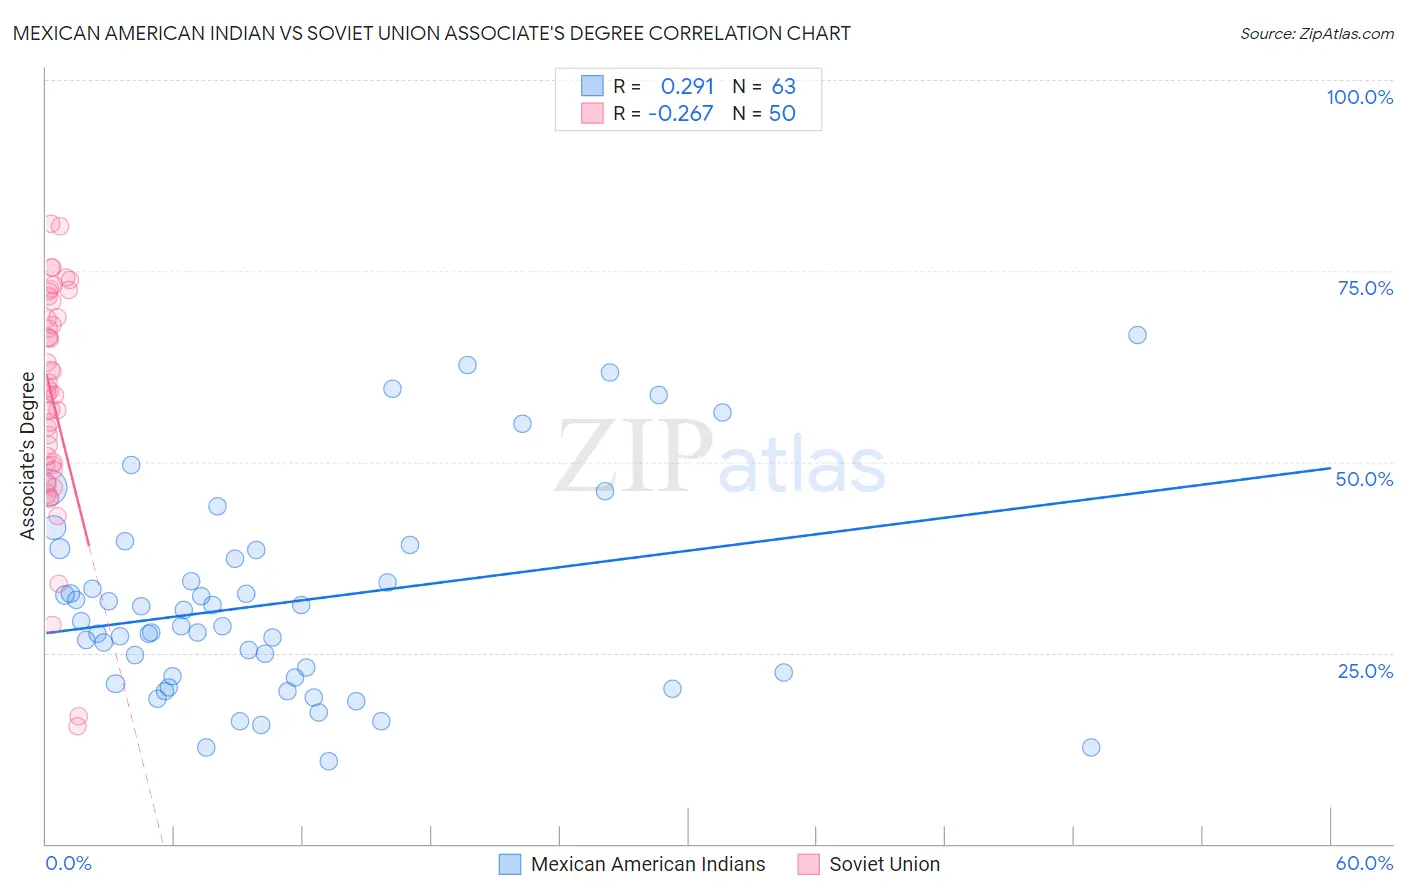
Mexican American Indian vs Soviet Union Associate's Degree Correlation Chart
The statistical analysis conducted on geographies consisting of 317,617,072 people shows a weak positive correlation between the proportion of Mexican American Indians and percentage of population with at least associate's degree education in the United States with a correlation coefficient (R) of 0.291 and weighted average of 38.2%. Similarly, the statistical analysis conducted on geographies consisting of 43,514,626 people shows a weak negative correlation between the proportion of Soviet Union and percentage of population with at least associate's degree education in the United States with a correlation coefficient (R) of -0.267 and weighted average of 55.1%, a difference of 44.5%.
Associate's Degree Correlation Summary
| Measurement | Mexican American Indian | Soviet Union |
| Minimum | 10.9% | 15.5% |
| Maximum | 66.7% | 81.2% |
| Range | 55.8% | 65.7% |
| Mean | 31.6% | 58.0% |
| Median | 28.6% | 59.1% |
| Interquartile 25% (IQ1) | 21.8% | 49.5% |
| Interquartile 75% (IQ3) | 38.5% | 68.9% |
| Interquartile Range (IQR) | 16.7% | 19.4% |
| Standard Deviation (Sample) | 13.3% | 14.7% |
| Standard Deviation (Population) | 13.2% | 14.5% |
Similar Demographics by Associate's Degree
Demographics Similar to Mexican American Indians by Associate's Degree
In terms of associate's degree, the demographic groups most similar to Mexican American Indians are Immigrants from Guatemala (38.1%, a difference of 0.040%), Immigrants from Dominican Republic (37.9%, a difference of 0.66%), Immigrants from El Salvador (38.4%, a difference of 0.67%), Shoshone (38.4%, a difference of 0.71%), and Immigrants from Latin America (37.9%, a difference of 0.77%).
| Demographics | Rating | Rank | Associate's Degree |
| Tsimshian | 0.0 /100 | #301 | Tragic 38.6% |
| Colville | 0.0 /100 | #302 | Tragic 38.5% |
| Guatemalans | 0.0 /100 | #303 | Tragic 38.5% |
| Sioux | 0.0 /100 | #304 | Tragic 38.5% |
| Immigrants | Honduras | 0.0 /100 | #305 | Tragic 38.5% |
| Shoshone | 0.0 /100 | #306 | Tragic 38.4% |
| Immigrants | El Salvador | 0.0 /100 | #307 | Tragic 38.4% |
| Mexican American Indians | 0.0 /100 | #308 | Tragic 38.2% |
| Immigrants | Guatemala | 0.0 /100 | #309 | Tragic 38.1% |
| Immigrants | Dominican Republic | 0.0 /100 | #310 | Tragic 37.9% |
| Immigrants | Latin America | 0.0 /100 | #311 | Tragic 37.9% |
| Choctaw | 0.0 /100 | #312 | Tragic 37.8% |
| Hispanics or Latinos | 0.0 /100 | #313 | Tragic 37.7% |
| Seminole | 0.0 /100 | #314 | Tragic 37.7% |
| Creek | 0.0 /100 | #315 | Tragic 37.6% |
Demographics Similar to Soviet Union by Associate's Degree
In terms of associate's degree, the demographic groups most similar to Soviet Union are Eastern European (55.0%, a difference of 0.14%), Immigrants from Eastern Asia (55.4%, a difference of 0.47%), Immigrants from Hong Kong (55.4%, a difference of 0.50%), Indian (Asian) (54.8%, a difference of 0.61%), and Immigrants from China (55.5%, a difference of 0.65%).
| Demographics | Rating | Rank | Associate's Degree |
| Immigrants | Israel | 100.0 /100 | #9 | Exceptional 56.8% |
| Cypriots | 100.0 /100 | #10 | Exceptional 56.4% |
| Immigrants | Australia | 100.0 /100 | #11 | Exceptional 55.8% |
| Immigrants | South Central Asia | 100.0 /100 | #12 | Exceptional 55.7% |
| Immigrants | China | 100.0 /100 | #13 | Exceptional 55.5% |
| Immigrants | Hong Kong | 100.0 /100 | #14 | Exceptional 55.4% |
| Immigrants | Eastern Asia | 100.0 /100 | #15 | Exceptional 55.4% |
| Soviet Union | 100.0 /100 | #16 | Exceptional 55.1% |
| Eastern Europeans | 100.0 /100 | #17 | Exceptional 55.0% |
| Indians (Asian) | 100.0 /100 | #18 | Exceptional 54.8% |
| Immigrants | Ireland | 100.0 /100 | #19 | Exceptional 54.7% |
| Cambodians | 100.0 /100 | #20 | Exceptional 54.6% |
| Immigrants | Sweden | 100.0 /100 | #21 | Exceptional 54.6% |
| Immigrants | Japan | 100.0 /100 | #22 | Exceptional 54.6% |
| Burmese | 100.0 /100 | #23 | Exceptional 54.6% |