Mexican American Indian vs Central American Associate's Degree
COMPARE
Mexican American Indian
Central American
Associate's Degree
Associate's Degree Comparison
Mexican American Indians
Central Americans
38.2%
ASSOCIATE'S DEGREE
0.0/ 100
METRIC RATING
308th/ 347
METRIC RANK
39.4%
ASSOCIATE'S DEGREE
0.0/ 100
METRIC RATING
289th/ 347
METRIC RANK
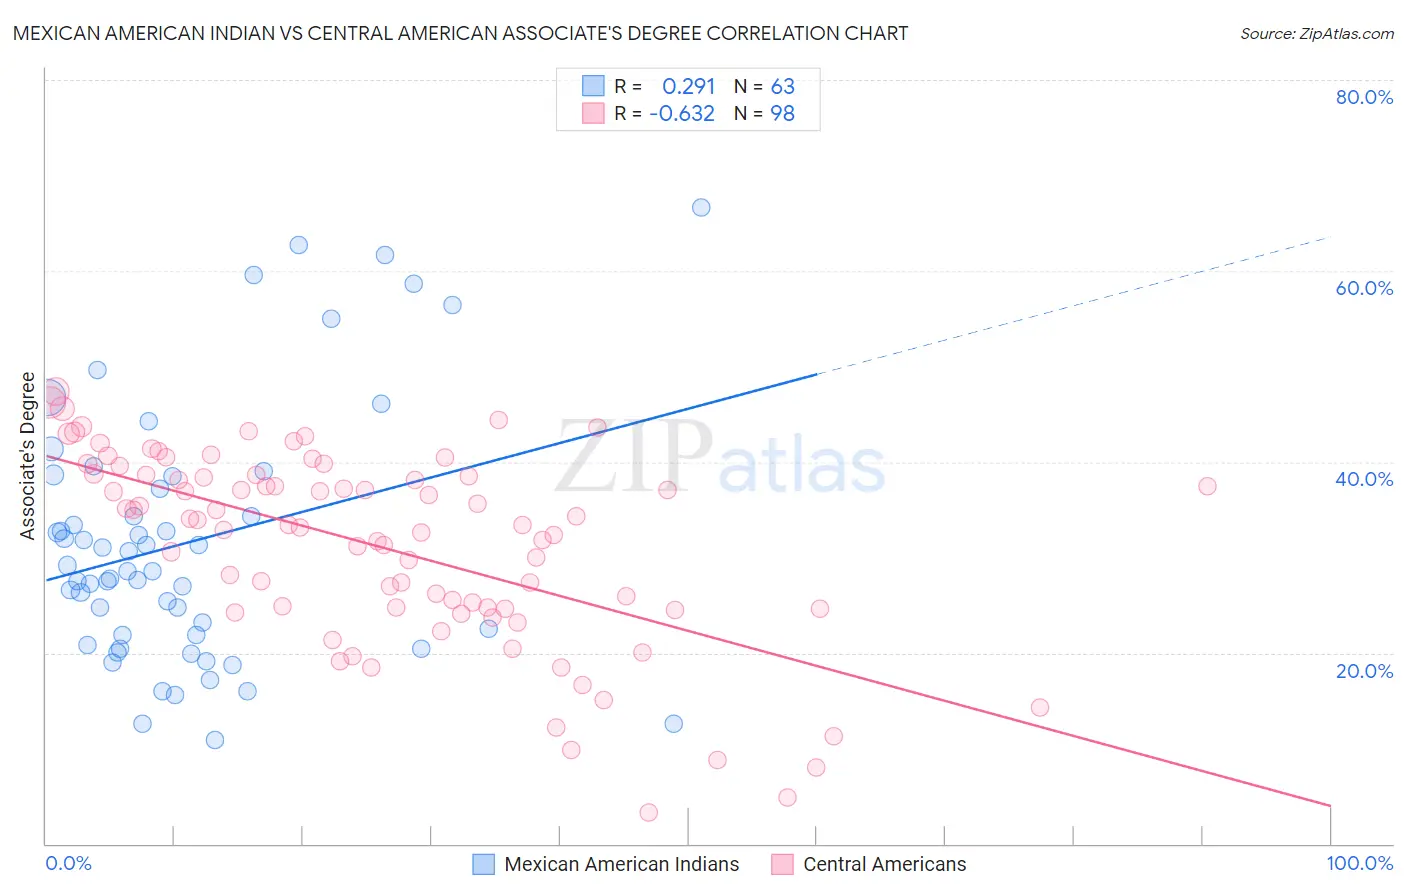
Mexican American Indian vs Central American Associate's Degree Correlation Chart
The statistical analysis conducted on geographies consisting of 317,617,072 people shows a weak positive correlation between the proportion of Mexican American Indians and percentage of population with at least associate's degree education in the United States with a correlation coefficient (R) of 0.291 and weighted average of 38.2%. Similarly, the statistical analysis conducted on geographies consisting of 504,559,402 people shows a significant negative correlation between the proportion of Central Americans and percentage of population with at least associate's degree education in the United States with a correlation coefficient (R) of -0.632 and weighted average of 39.4%, a difference of 3.4%.
Associate's Degree Correlation Summary
| Measurement | Mexican American Indian | Central American |
| Minimum | 10.9% | 3.3% |
| Maximum | 66.7% | 47.4% |
| Range | 55.8% | 44.0% |
| Mean | 31.6% | 31.1% |
| Median | 28.6% | 33.4% |
| Interquartile 25% (IQ1) | 21.8% | 24.6% |
| Interquartile 75% (IQ3) | 38.5% | 38.6% |
| Interquartile Range (IQR) | 16.7% | 14.0% |
| Standard Deviation (Sample) | 13.3% | 10.1% |
| Standard Deviation (Population) | 13.2% | 10.0% |
Demographics Similar to Mexican American Indians and Central Americans by Associate's Degree
In terms of associate's degree, the demographic groups most similar to Mexican American Indians are Immigrants from El Salvador (38.4%, a difference of 0.67%), Shoshone (38.4%, a difference of 0.71%), Immigrants from Honduras (38.5%, a difference of 0.78%), Sioux (38.5%, a difference of 0.85%), and Guatemalan (38.5%, a difference of 0.90%). Similarly, the demographic groups most similar to Central Americans are Immigrants from Cuba (39.5%, a difference of 0.26%), Immigrants from Haiti (39.3%, a difference of 0.44%), Dominican (39.3%, a difference of 0.46%), Black/African American (39.1%, a difference of 0.75%), and Nepalese (39.0%, a difference of 1.0%).
| Demographics | Rating | Rank | Associate's Degree |
| Immigrants | Cuba | 0.0 /100 | #288 | Tragic 39.5% |
| Central Americans | 0.0 /100 | #289 | Tragic 39.4% |
| Immigrants | Haiti | 0.0 /100 | #290 | Tragic 39.3% |
| Dominicans | 0.0 /100 | #291 | Tragic 39.3% |
| Blacks/African Americans | 0.0 /100 | #292 | Tragic 39.1% |
| Nepalese | 0.0 /100 | #293 | Tragic 39.0% |
| Salvadorans | 0.0 /100 | #294 | Tragic 39.0% |
| Hondurans | 0.0 /100 | #295 | Tragic 38.9% |
| Cherokee | 0.0 /100 | #296 | Tragic 38.9% |
| Cape Verdeans | 0.0 /100 | #297 | Tragic 38.8% |
| Cheyenne | 0.0 /100 | #298 | Tragic 38.7% |
| Ute | 0.0 /100 | #299 | Tragic 38.6% |
| Chickasaw | 0.0 /100 | #300 | Tragic 38.6% |
| Tsimshian | 0.0 /100 | #301 | Tragic 38.6% |
| Colville | 0.0 /100 | #302 | Tragic 38.5% |
| Guatemalans | 0.0 /100 | #303 | Tragic 38.5% |
| Sioux | 0.0 /100 | #304 | Tragic 38.5% |
| Immigrants | Honduras | 0.0 /100 | #305 | Tragic 38.5% |
| Shoshone | 0.0 /100 | #306 | Tragic 38.4% |
| Immigrants | El Salvador | 0.0 /100 | #307 | Tragic 38.4% |
| Mexican American Indians | 0.0 /100 | #308 | Tragic 38.2% |