Osage vs Paiute College, Under 1 year
COMPARE
Osage
Paiute
College, Under 1 year
College, Under 1 year Comparison
Osage
Paiute
62.7%
COLLEGE, UNDER 1 YEAR
2.2/ 100
METRIC RATING
232nd/ 347
METRIC RANK
59.6%
COLLEGE, UNDER 1 YEAR
0.0/ 100
METRIC RATING
285th/ 347
METRIC RANK
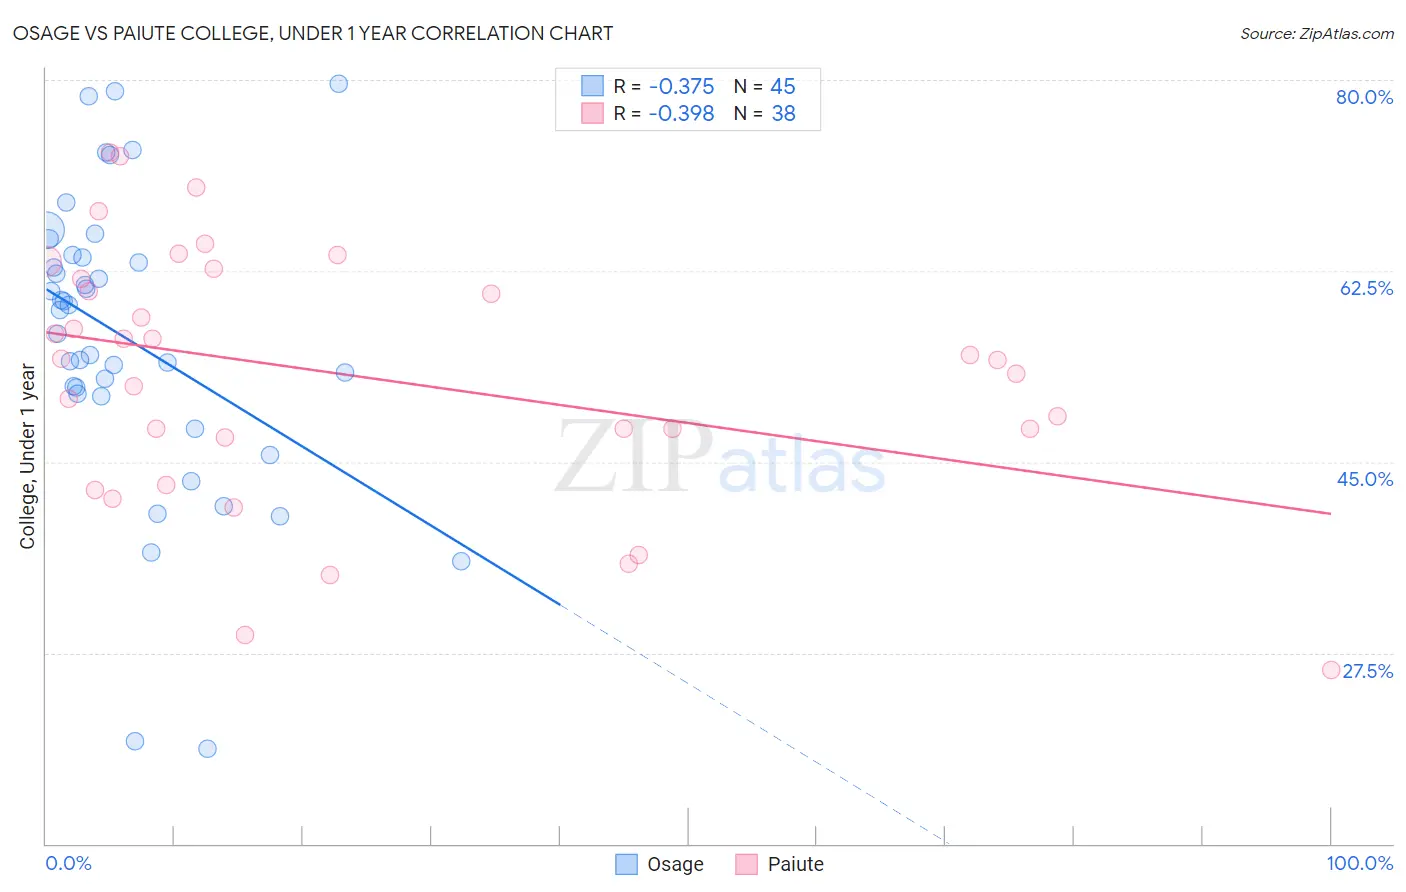
Osage vs Paiute College, Under 1 year Correlation Chart
The statistical analysis conducted on geographies consisting of 91,808,929 people shows a mild negative correlation between the proportion of Osage and percentage of population with at least college, under 1 year education in the United States with a correlation coefficient (R) of -0.375 and weighted average of 62.7%. Similarly, the statistical analysis conducted on geographies consisting of 58,404,248 people shows a mild negative correlation between the proportion of Paiute and percentage of population with at least college, under 1 year education in the United States with a correlation coefficient (R) of -0.398 and weighted average of 59.6%, a difference of 5.1%.
College, Under 1 year Correlation Summary
| Measurement | Osage | Paiute |
| Minimum | 18.8% | 25.9% |
| Maximum | 79.7% | 73.3% |
| Range | 60.9% | 47.4% |
| Mean | 56.2% | 52.9% |
| Median | 58.9% | 54.4% |
| Interquartile 25% (IQ1) | 51.1% | 47.3% |
| Interquartile 75% (IQ3) | 63.8% | 61.8% |
| Interquartile Range (IQR) | 12.7% | 14.5% |
| Standard Deviation (Sample) | 13.5% | 11.7% |
| Standard Deviation (Population) | 13.4% | 11.5% |
Similar Demographics by College, Under 1 year
Demographics Similar to Osage by College, Under 1 year
In terms of college, under 1 year, the demographic groups most similar to Osage are Immigrants from Western Africa (62.8%, a difference of 0.11%), Iroquois (62.6%, a difference of 0.12%), Chippewa (62.6%, a difference of 0.15%), Spanish American (62.6%, a difference of 0.20%), and Immigrants (62.5%, a difference of 0.33%).
| Demographics | Rating | Rank | College, Under 1 year |
| Immigrants | Peru | 4.0 /100 | #225 | Tragic 63.1% |
| Immigrants | Colombia | 4.0 /100 | #226 | Tragic 63.1% |
| Immigrants | Ghana | 3.7 /100 | #227 | Tragic 63.1% |
| Samoans | 3.3 /100 | #228 | Tragic 63.0% |
| Liberians | 3.2 /100 | #229 | Tragic 63.0% |
| Immigrants | Nonimmigrants | 3.0 /100 | #230 | Tragic 62.9% |
| Immigrants | Western Africa | 2.4 /100 | #231 | Tragic 62.8% |
| Osage | 2.2 /100 | #232 | Tragic 62.7% |
| Iroquois | 2.0 /100 | #233 | Tragic 62.6% |
| Chippewa | 2.0 /100 | #234 | Tragic 62.6% |
| Spanish Americans | 1.9 /100 | #235 | Tragic 62.6% |
| Immigrants | Immigrants | 1.7 /100 | #236 | Tragic 62.5% |
| Immigrants | Burma/Myanmar | 1.6 /100 | #237 | Tragic 62.5% |
| French American Indians | 1.5 /100 | #238 | Tragic 62.4% |
| Nepalese | 1.1 /100 | #239 | Tragic 62.2% |
Demographics Similar to Paiute by College, Under 1 year
In terms of college, under 1 year, the demographic groups most similar to Paiute are Immigrants from St. Vincent and the Grenadines (59.6%, a difference of 0.010%), Immigrants from Jamaica (59.7%, a difference of 0.12%), British West Indian (59.5%, a difference of 0.14%), Sioux (59.4%, a difference of 0.31%), and Black/African American (59.4%, a difference of 0.41%).
| Demographics | Rating | Rank | College, Under 1 year |
| Yaqui | 0.1 /100 | #278 | Tragic 60.2% |
| Ute | 0.1 /100 | #279 | Tragic 60.2% |
| Crow | 0.1 /100 | #280 | Tragic 60.2% |
| Cherokee | 0.1 /100 | #281 | Tragic 60.1% |
| Belizeans | 0.1 /100 | #282 | Tragic 60.1% |
| Immigrants | Jamaica | 0.0 /100 | #283 | Tragic 59.7% |
| Immigrants | St. Vincent and the Grenadines | 0.0 /100 | #284 | Tragic 59.6% |
| Paiute | 0.0 /100 | #285 | Tragic 59.6% |
| British West Indians | 0.0 /100 | #286 | Tragic 59.5% |
| Sioux | 0.0 /100 | #287 | Tragic 59.4% |
| Blacks/African Americans | 0.0 /100 | #288 | Tragic 59.4% |
| Choctaw | 0.0 /100 | #289 | Tragic 59.3% |
| Ecuadorians | 0.0 /100 | #290 | Tragic 59.3% |
| Creek | 0.0 /100 | #291 | Tragic 59.3% |
| Nicaraguans | 0.0 /100 | #292 | Tragic 59.2% |