Maltese vs Immigrants from Japan No Schooling Completed
COMPARE
Maltese
Immigrants from Japan
No Schooling Completed
No Schooling Completed Comparison
Maltese
Immigrants from Japan
1.6%
NO SCHOOLING COMPLETED
99.9/ 100
METRIC RATING
46th/ 347
METRIC RANK
1.9%
NO SCHOOLING COMPLETED
96.6/ 100
METRIC RATING
111th/ 347
METRIC RANK
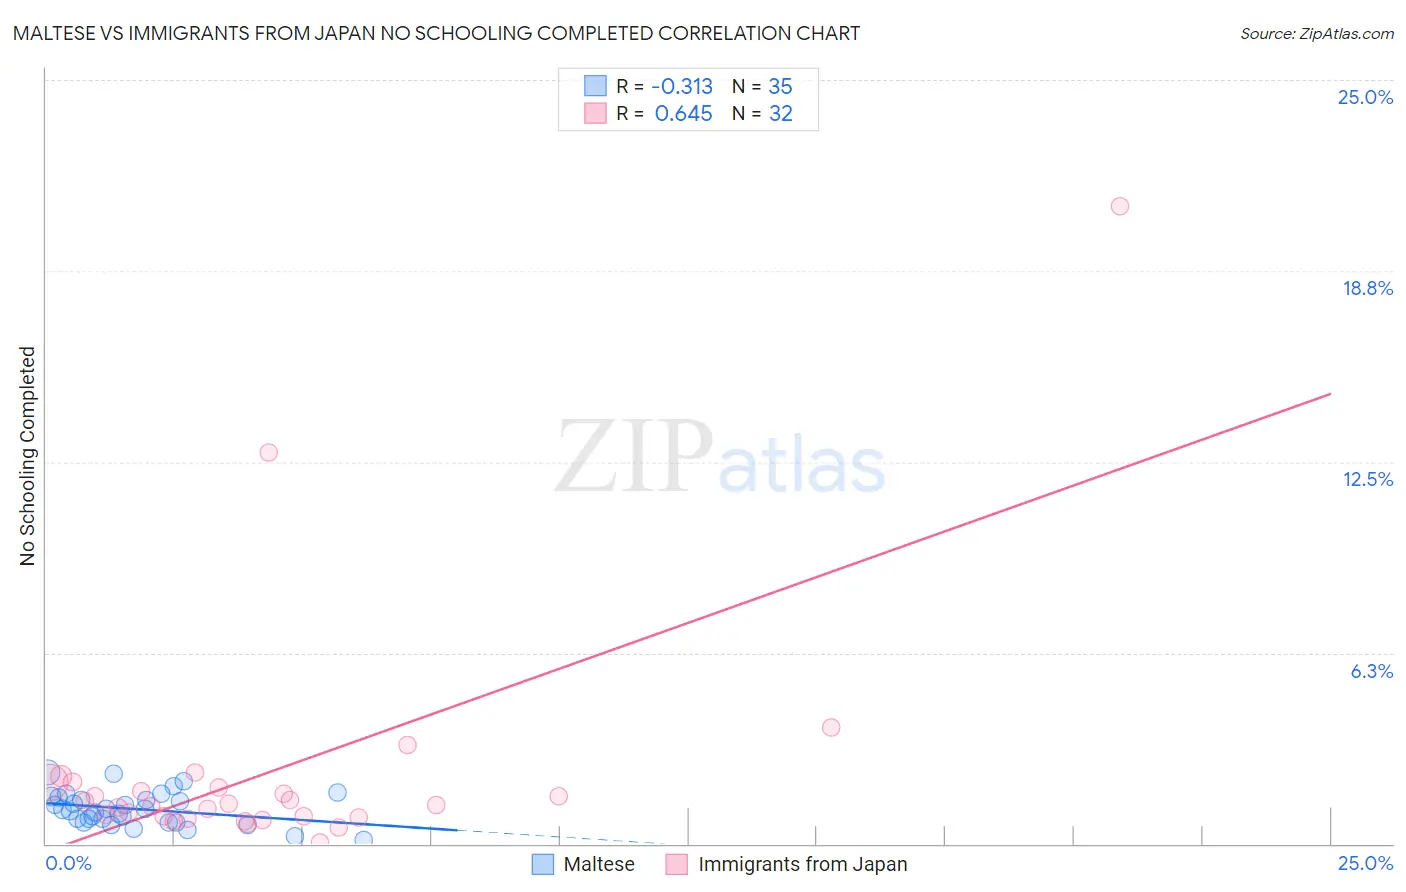
Maltese vs Immigrants from Japan No Schooling Completed Correlation Chart
The statistical analysis conducted on geographies consisting of 126,020,620 people shows a mild negative correlation between the proportion of Maltese and percentage of population with no schooling in the United States with a correlation coefficient (R) of -0.313 and weighted average of 1.6%. Similarly, the statistical analysis conducted on geographies consisting of 337,168,238 people shows a significant positive correlation between the proportion of Immigrants from Japan and percentage of population with no schooling in the United States with a correlation coefficient (R) of 0.645 and weighted average of 1.9%, a difference of 14.4%.
No Schooling Completed Correlation Summary
| Measurement | Maltese | Immigrants from Japan |
| Minimum | 0.11% | 0.022% |
| Maximum | 2.3% | 20.9% |
| Range | 2.2% | 20.9% |
| Mean | 1.1% | 2.4% |
| Median | 1.1% | 1.3% |
| Interquartile 25% (IQ1) | 0.70% | 0.88% |
| Interquartile 75% (IQ3) | 1.5% | 1.9% |
| Interquartile Range (IQR) | 0.80% | 1.0% |
| Standard Deviation (Sample) | 0.54% | 4.0% |
| Standard Deviation (Population) | 0.53% | 3.9% |
Similar Demographics by No Schooling Completed
Demographics Similar to Maltese by No Schooling Completed
In terms of no schooling completed, the demographic groups most similar to Maltese are Czechoslovakian (1.6%, a difference of 0.090%), Estonian (1.6%, a difference of 0.13%), Ottawa (1.6%, a difference of 0.14%), Australian (1.6%, a difference of 0.32%), and Immigrants from Scotland (1.6%, a difference of 0.40%).
| Demographics | Rating | Rank | No Schooling Completed |
| Native Hawaiians | 99.9 /100 | #39 | Exceptional 1.6% |
| Luxembourgers | 99.9 /100 | #40 | Exceptional 1.6% |
| Hungarians | 99.9 /100 | #41 | Exceptional 1.6% |
| Bulgarians | 99.9 /100 | #42 | Exceptional 1.6% |
| Australians | 99.9 /100 | #43 | Exceptional 1.6% |
| Estonians | 99.9 /100 | #44 | Exceptional 1.6% |
| Czechoslovakians | 99.9 /100 | #45 | Exceptional 1.6% |
| Maltese | 99.9 /100 | #46 | Exceptional 1.6% |
| Ottawa | 99.9 /100 | #47 | Exceptional 1.6% |
| Immigrants | Scotland | 99.9 /100 | #48 | Exceptional 1.6% |
| Whites/Caucasians | 99.9 /100 | #49 | Exceptional 1.6% |
| Celtics | 99.9 /100 | #50 | Exceptional 1.6% |
| Chippewa | 99.8 /100 | #51 | Exceptional 1.6% |
| Immigrants | Canada | 99.8 /100 | #52 | Exceptional 1.6% |
| Creek | 99.8 /100 | #53 | Exceptional 1.6% |
Demographics Similar to Immigrants from Japan by No Schooling Completed
In terms of no schooling completed, the demographic groups most similar to Immigrants from Japan are Immigrants from Latvia (1.9%, a difference of 0.15%), Pueblo (1.9%, a difference of 0.19%), Immigrants from Saudi Arabia (1.9%, a difference of 0.28%), Immigrants from Zimbabwe (1.9%, a difference of 0.43%), and Immigrants from Norway (1.9%, a difference of 0.44%).
| Demographics | Rating | Rank | No Schooling Completed |
| Thais | 97.5 /100 | #104 | Exceptional 1.8% |
| German Russians | 97.5 /100 | #105 | Exceptional 1.8% |
| Immigrants | France | 97.3 /100 | #106 | Exceptional 1.8% |
| Yugoslavians | 97.2 /100 | #107 | Exceptional 1.8% |
| Okinawans | 97.1 /100 | #108 | Exceptional 1.8% |
| Immigrants | Saudi Arabia | 96.8 /100 | #109 | Exceptional 1.9% |
| Immigrants | Latvia | 96.7 /100 | #110 | Exceptional 1.9% |
| Immigrants | Japan | 96.6 /100 | #111 | Exceptional 1.9% |
| Pueblo | 96.4 /100 | #112 | Exceptional 1.9% |
| Immigrants | Zimbabwe | 96.2 /100 | #113 | Exceptional 1.9% |
| Immigrants | Norway | 96.1 /100 | #114 | Exceptional 1.9% |
| Syrians | 96.0 /100 | #115 | Exceptional 1.9% |
| Lebanese | 96.0 /100 | #116 | Exceptional 1.9% |
| Immigrants | Serbia | 95.8 /100 | #117 | Exceptional 1.9% |
| Spanish | 95.5 /100 | #118 | Exceptional 1.9% |