Maltese vs Immigrants from Scotland No Schooling Completed
COMPARE
Maltese
Immigrants from Scotland
No Schooling Completed
No Schooling Completed Comparison
Maltese
Immigrants from Scotland
1.6%
NO SCHOOLING COMPLETED
99.9/ 100
METRIC RATING
46th/ 347
METRIC RANK
1.6%
NO SCHOOLING COMPLETED
99.9/ 100
METRIC RATING
48th/ 347
METRIC RANK
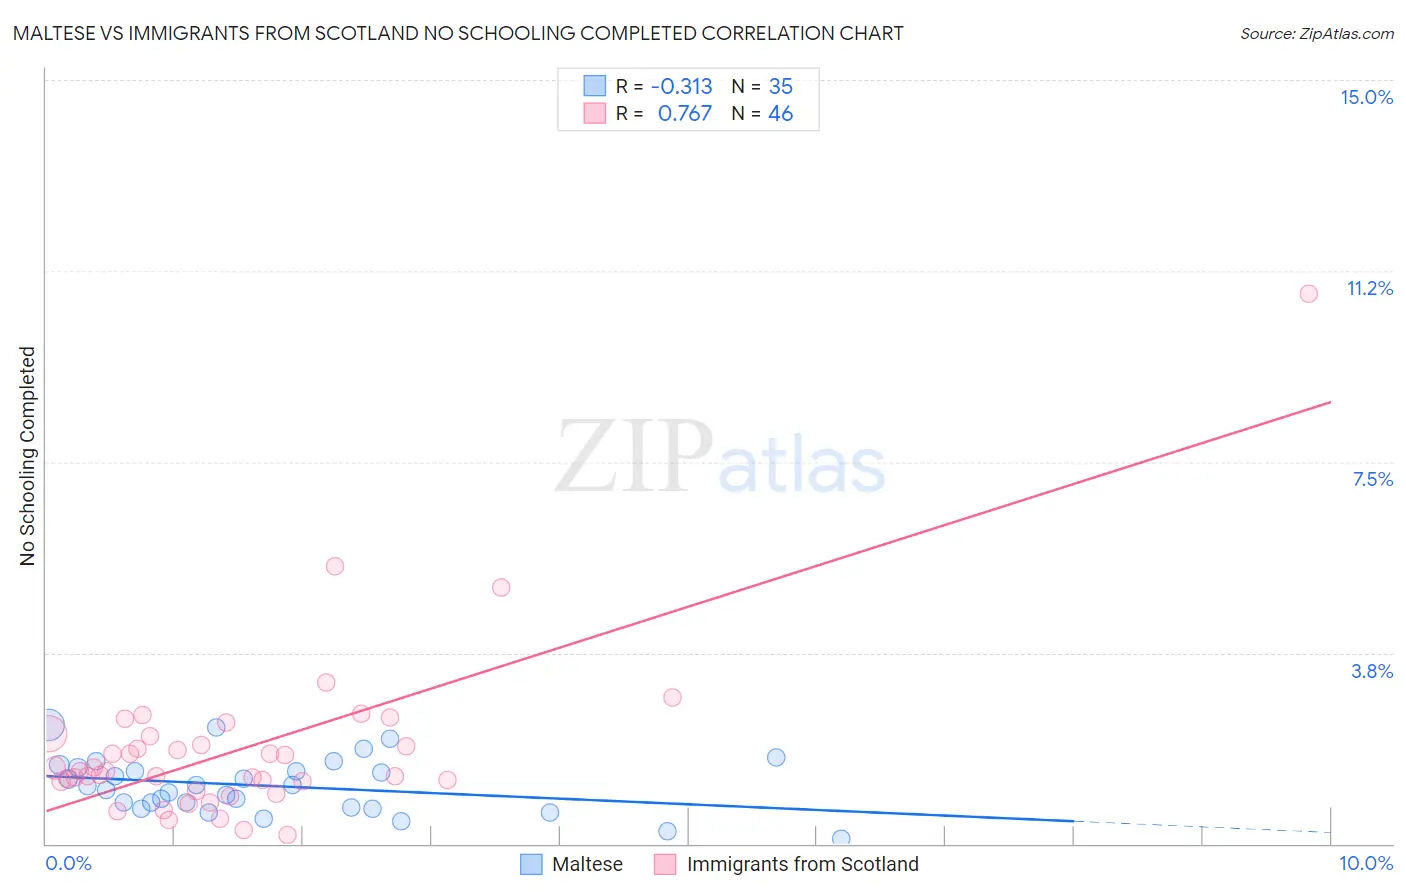
Maltese vs Immigrants from Scotland No Schooling Completed Correlation Chart
The statistical analysis conducted on geographies consisting of 126,020,620 people shows a mild negative correlation between the proportion of Maltese and percentage of population with no schooling in the United States with a correlation coefficient (R) of -0.313 and weighted average of 1.6%. Similarly, the statistical analysis conducted on geographies consisting of 195,168,886 people shows a strong positive correlation between the proportion of Immigrants from Scotland and percentage of population with no schooling in the United States with a correlation coefficient (R) of 0.767 and weighted average of 1.6%, a difference of 0.40%.
No Schooling Completed Correlation Summary
| Measurement | Maltese | Immigrants from Scotland |
| Minimum | 0.11% | 0.17% |
| Maximum | 2.3% | 10.8% |
| Range | 2.2% | 10.6% |
| Mean | 1.1% | 1.9% |
| Median | 1.1% | 1.4% |
| Interquartile 25% (IQ1) | 0.70% | 1.2% |
| Interquartile 75% (IQ3) | 1.5% | 2.1% |
| Interquartile Range (IQR) | 0.80% | 0.90% |
| Standard Deviation (Sample) | 0.54% | 1.7% |
| Standard Deviation (Population) | 0.53% | 1.7% |
Demographics Similar to Maltese and Immigrants from Scotland by No Schooling Completed
In terms of no schooling completed, the demographic groups most similar to Maltese are Czechoslovakian (1.6%, a difference of 0.090%), Estonian (1.6%, a difference of 0.13%), Ottawa (1.6%, a difference of 0.14%), Australian (1.6%, a difference of 0.32%), and Bulgarian (1.6%, a difference of 0.44%). Similarly, the demographic groups most similar to Immigrants from Scotland are White/Caucasian (1.6%, a difference of 0.060%), Celtic (1.6%, a difference of 0.19%), Ottawa (1.6%, a difference of 0.26%), Chippewa (1.6%, a difference of 0.39%), and Immigrants from Canada (1.6%, a difference of 0.46%).
| Demographics | Rating | Rank | No Schooling Completed |
| Belgians | 99.9 /100 | #37 | Exceptional 1.6% |
| Northern Europeans | 99.9 /100 | #38 | Exceptional 1.6% |
| Native Hawaiians | 99.9 /100 | #39 | Exceptional 1.6% |
| Luxembourgers | 99.9 /100 | #40 | Exceptional 1.6% |
| Hungarians | 99.9 /100 | #41 | Exceptional 1.6% |
| Bulgarians | 99.9 /100 | #42 | Exceptional 1.6% |
| Australians | 99.9 /100 | #43 | Exceptional 1.6% |
| Estonians | 99.9 /100 | #44 | Exceptional 1.6% |
| Czechoslovakians | 99.9 /100 | #45 | Exceptional 1.6% |
| Maltese | 99.9 /100 | #46 | Exceptional 1.6% |
| Ottawa | 99.9 /100 | #47 | Exceptional 1.6% |
| Immigrants | Scotland | 99.9 /100 | #48 | Exceptional 1.6% |
| Whites/Caucasians | 99.9 /100 | #49 | Exceptional 1.6% |
| Celtics | 99.9 /100 | #50 | Exceptional 1.6% |
| Chippewa | 99.8 /100 | #51 | Exceptional 1.6% |
| Immigrants | Canada | 99.8 /100 | #52 | Exceptional 1.6% |
| Creek | 99.8 /100 | #53 | Exceptional 1.6% |
| Crow | 99.8 /100 | #54 | Exceptional 1.6% |
| Greeks | 99.8 /100 | #55 | Exceptional 1.6% |
| Immigrants | North America | 99.8 /100 | #56 | Exceptional 1.6% |
| Austrians | 99.8 /100 | #57 | Exceptional 1.6% |