Maltese vs Central American Indian High School Diploma
COMPARE
Maltese
Central American Indian
High School Diploma
High School Diploma Comparison
Maltese
Central American Indians
91.6%
HIGH SCHOOL DIPLOMA
99.9/ 100
METRIC RATING
19th/ 347
METRIC RANK
84.2%
HIGH SCHOOL DIPLOMA
0.0/ 100
METRIC RATING
319th/ 347
METRIC RANK
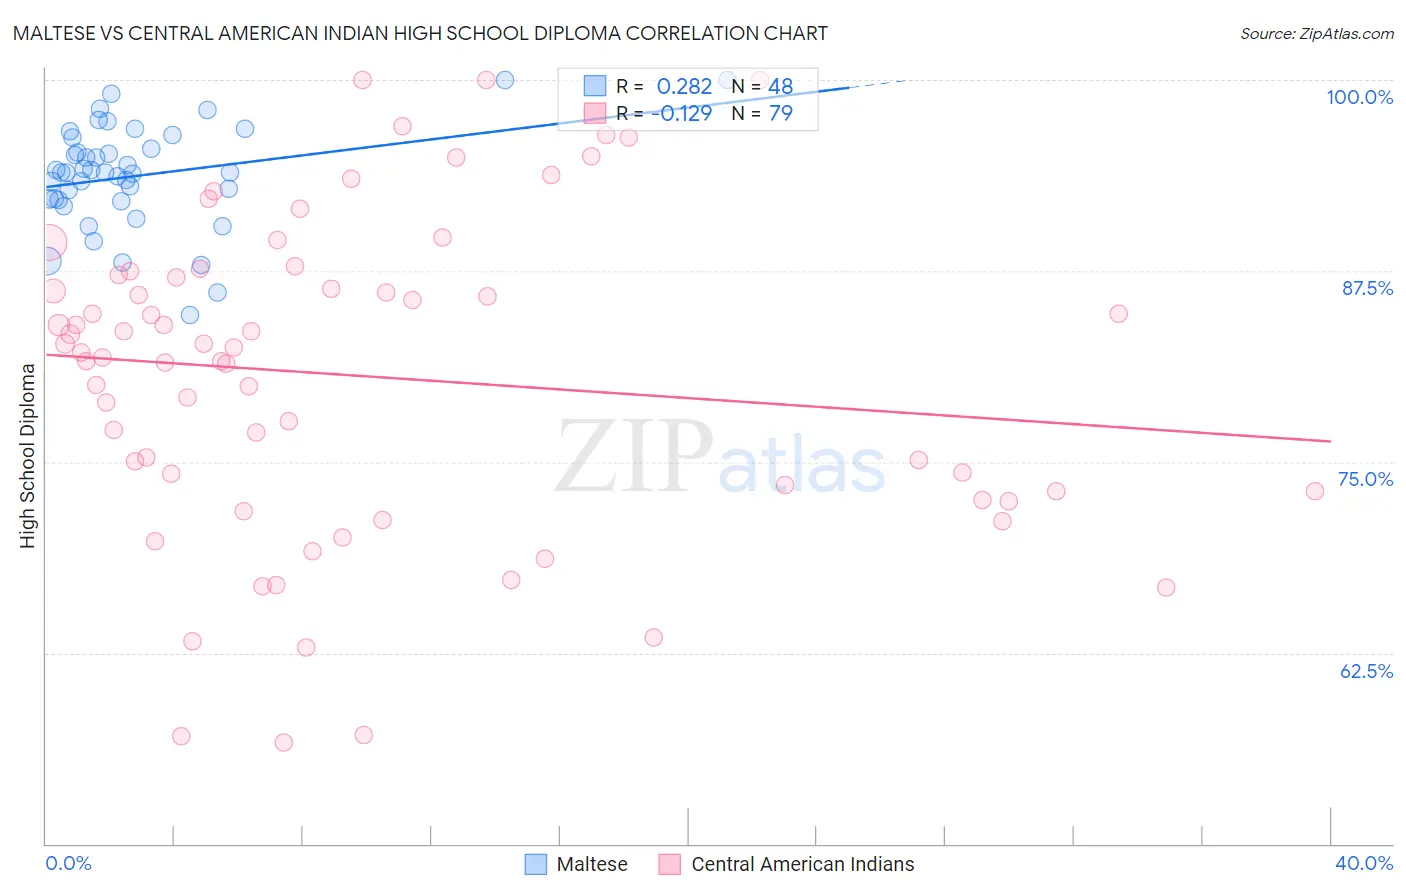
Maltese vs Central American Indian High School Diploma Correlation Chart
The statistical analysis conducted on geographies consisting of 126,478,070 people shows a weak positive correlation between the proportion of Maltese and percentage of population with at least high school diploma education in the United States with a correlation coefficient (R) of 0.282 and weighted average of 91.6%. Similarly, the statistical analysis conducted on geographies consisting of 326,142,643 people shows a poor negative correlation between the proportion of Central American Indians and percentage of population with at least high school diploma education in the United States with a correlation coefficient (R) of -0.129 and weighted average of 84.2%, a difference of 8.8%.
High School Diploma Correlation Summary
| Measurement | Maltese | Central American Indian |
| Minimum | 84.6% | 56.6% |
| Maximum | 100.0% | 100.0% |
| Range | 15.4% | 43.4% |
| Mean | 93.7% | 80.6% |
| Median | 94.0% | 82.2% |
| Interquartile 25% (IQ1) | 92.2% | 73.1% |
| Interquartile 75% (IQ3) | 95.9% | 87.3% |
| Interquartile Range (IQR) | 3.7% | 14.2% |
| Standard Deviation (Sample) | 3.4% | 10.4% |
| Standard Deviation (Population) | 3.3% | 10.3% |
Similar Demographics by High School Diploma
Demographics Similar to Maltese by High School Diploma
In terms of high school diploma, the demographic groups most similar to Maltese are Czech (91.6%, a difference of 0.030%), Filipino (91.6%, a difference of 0.040%), Estonian (91.6%, a difference of 0.050%), Immigrants from Singapore (91.7%, a difference of 0.080%), and German (91.7%, a difference of 0.080%).
| Demographics | Rating | Rank | High School Diploma |
| Poles | 100.0 /100 | #12 | Exceptional 91.9% |
| Danes | 100.0 /100 | #13 | Exceptional 91.8% |
| Bulgarians | 100.0 /100 | #14 | Exceptional 91.8% |
| Luxembourgers | 100.0 /100 | #15 | Exceptional 91.7% |
| Finns | 100.0 /100 | #16 | Exceptional 91.7% |
| Immigrants | Singapore | 99.9 /100 | #17 | Exceptional 91.7% |
| Germans | 99.9 /100 | #18 | Exceptional 91.7% |
| Maltese | 99.9 /100 | #19 | Exceptional 91.6% |
| Czechs | 99.9 /100 | #20 | Exceptional 91.6% |
| Filipinos | 99.9 /100 | #21 | Exceptional 91.6% |
| Estonians | 99.9 /100 | #22 | Exceptional 91.6% |
| Scandinavians | 99.9 /100 | #23 | Exceptional 91.5% |
| Italians | 99.9 /100 | #24 | Exceptional 91.5% |
| Thais | 99.9 /100 | #25 | Exceptional 91.5% |
| Russians | 99.9 /100 | #26 | Exceptional 91.5% |
Demographics Similar to Central American Indians by High School Diploma
In terms of high school diploma, the demographic groups most similar to Central American Indians are Immigrants from Belize (84.2%, a difference of 0.040%), Nicaraguan (84.1%, a difference of 0.10%), Immigrants from Caribbean (84.3%, a difference of 0.11%), Belizean (84.3%, a difference of 0.16%), and Yuman (84.0%, a difference of 0.24%).
| Demographics | Rating | Rank | High School Diploma |
| Cape Verdeans | 0.0 /100 | #312 | Tragic 85.1% |
| Immigrants | Ecuador | 0.0 /100 | #313 | Tragic 84.8% |
| Yaqui | 0.0 /100 | #314 | Tragic 84.7% |
| Puerto Ricans | 0.0 /100 | #315 | Tragic 84.7% |
| Belizeans | 0.0 /100 | #316 | Tragic 84.3% |
| Immigrants | Caribbean | 0.0 /100 | #317 | Tragic 84.3% |
| Immigrants | Belize | 0.0 /100 | #318 | Tragic 84.2% |
| Central American Indians | 0.0 /100 | #319 | Tragic 84.2% |
| Nicaraguans | 0.0 /100 | #320 | Tragic 84.1% |
| Yuman | 0.0 /100 | #321 | Tragic 84.0% |
| Lumbee | 0.0 /100 | #322 | Tragic 83.6% |
| Immigrants | Cuba | 0.0 /100 | #323 | Tragic 83.5% |
| Immigrants | Cabo Verde | 0.0 /100 | #324 | Tragic 83.3% |
| Immigrants | Nicaragua | 0.0 /100 | #325 | Tragic 83.1% |
| Mexican American Indians | 0.0 /100 | #326 | Tragic 83.0% |