Vietnamese vs Central American Indian High School Diploma
COMPARE
Vietnamese
Central American Indian
High School Diploma
High School Diploma Comparison
Vietnamese
Central American Indians
85.4%
HIGH SCHOOL DIPLOMA
0.0/ 100
METRIC RATING
301st/ 347
METRIC RANK
84.2%
HIGH SCHOOL DIPLOMA
0.0/ 100
METRIC RATING
319th/ 347
METRIC RANK
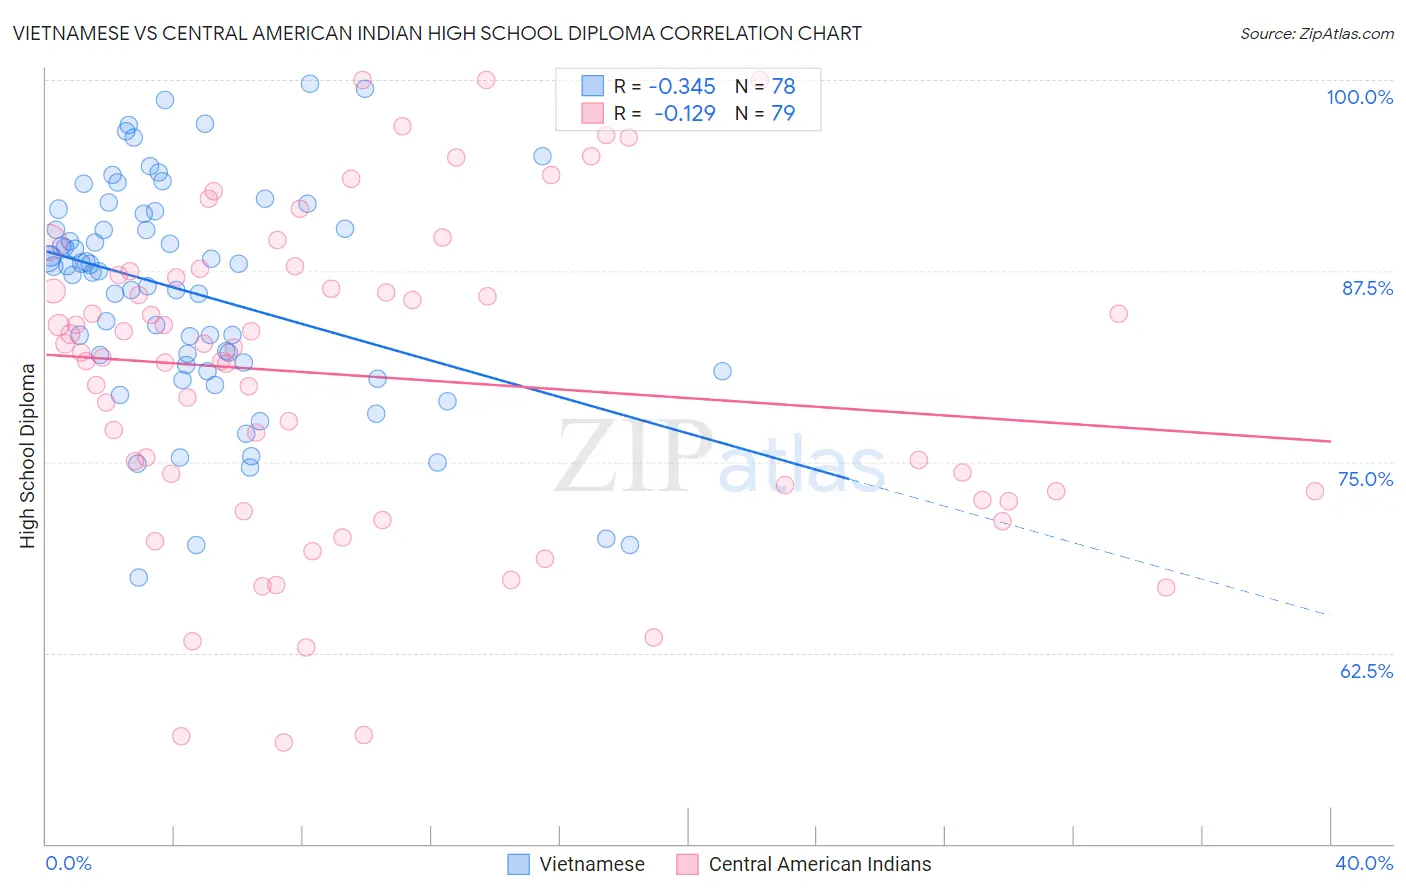
Vietnamese vs Central American Indian High School Diploma Correlation Chart
The statistical analysis conducted on geographies consisting of 170,753,564 people shows a mild negative correlation between the proportion of Vietnamese and percentage of population with at least high school diploma education in the United States with a correlation coefficient (R) of -0.345 and weighted average of 85.4%. Similarly, the statistical analysis conducted on geographies consisting of 326,142,643 people shows a poor negative correlation between the proportion of Central American Indians and percentage of population with at least high school diploma education in the United States with a correlation coefficient (R) of -0.129 and weighted average of 84.2%, a difference of 1.5%.
High School Diploma Correlation Summary
| Measurement | Vietnamese | Central American Indian |
| Minimum | 67.5% | 56.6% |
| Maximum | 99.8% | 100.0% |
| Range | 32.3% | 43.4% |
| Mean | 86.1% | 80.6% |
| Median | 87.6% | 82.2% |
| Interquartile 25% (IQ1) | 81.3% | 73.1% |
| Interquartile 75% (IQ3) | 91.3% | 87.3% |
| Interquartile Range (IQR) | 9.9% | 14.2% |
| Standard Deviation (Sample) | 7.3% | 10.4% |
| Standard Deviation (Population) | 7.3% | 10.3% |
Demographics Similar to Vietnamese and Central American Indians by High School Diploma
In terms of high school diploma, the demographic groups most similar to Vietnamese are Immigrants from Bangladesh (85.5%, a difference of 0.020%), Immigrants from Haiti (85.4%, a difference of 0.040%), Cuban (85.4%, a difference of 0.040%), Nepalese (85.3%, a difference of 0.15%), and Immigrants from Portugal (85.3%, a difference of 0.15%). Similarly, the demographic groups most similar to Central American Indians are Immigrants from Belize (84.2%, a difference of 0.040%), Nicaraguan (84.1%, a difference of 0.10%), Immigrants from Caribbean (84.3%, a difference of 0.11%), Belizean (84.3%, a difference of 0.16%), and Puerto Rican (84.7%, a difference of 0.57%).
| Demographics | Rating | Rank | High School Diploma |
| Immigrants | Bangladesh | 0.0 /100 | #300 | Tragic 85.5% |
| Vietnamese | 0.0 /100 | #301 | Tragic 85.4% |
| Immigrants | Haiti | 0.0 /100 | #302 | Tragic 85.4% |
| Cubans | 0.0 /100 | #303 | Tragic 85.4% |
| Nepalese | 0.0 /100 | #304 | Tragic 85.3% |
| Immigrants | Portugal | 0.0 /100 | #305 | Tragic 85.3% |
| Immigrants | Guyana | 0.0 /100 | #306 | Tragic 85.3% |
| Navajo | 0.0 /100 | #307 | Tragic 85.2% |
| Immigrants | Armenia | 0.0 /100 | #308 | Tragic 85.2% |
| Immigrants | Dominica | 0.0 /100 | #309 | Tragic 85.2% |
| Apache | 0.0 /100 | #310 | Tragic 85.1% |
| Ecuadorians | 0.0 /100 | #311 | Tragic 85.1% |
| Cape Verdeans | 0.0 /100 | #312 | Tragic 85.1% |
| Immigrants | Ecuador | 0.0 /100 | #313 | Tragic 84.8% |
| Yaqui | 0.0 /100 | #314 | Tragic 84.7% |
| Puerto Ricans | 0.0 /100 | #315 | Tragic 84.7% |
| Belizeans | 0.0 /100 | #316 | Tragic 84.3% |
| Immigrants | Caribbean | 0.0 /100 | #317 | Tragic 84.3% |
| Immigrants | Belize | 0.0 /100 | #318 | Tragic 84.2% |
| Central American Indians | 0.0 /100 | #319 | Tragic 84.2% |
| Nicaraguans | 0.0 /100 | #320 | Tragic 84.1% |