Maltese vs Immigrants from Russia High School Diploma
COMPARE
Maltese
Immigrants from Russia
High School Diploma
High School Diploma Comparison
Maltese
Immigrants from Russia
91.6%
HIGH SCHOOL DIPLOMA
99.9/ 100
METRIC RATING
19th/ 347
METRIC RANK
90.3%
HIGH SCHOOL DIPLOMA
96.9/ 100
METRIC RATING
107th/ 347
METRIC RANK
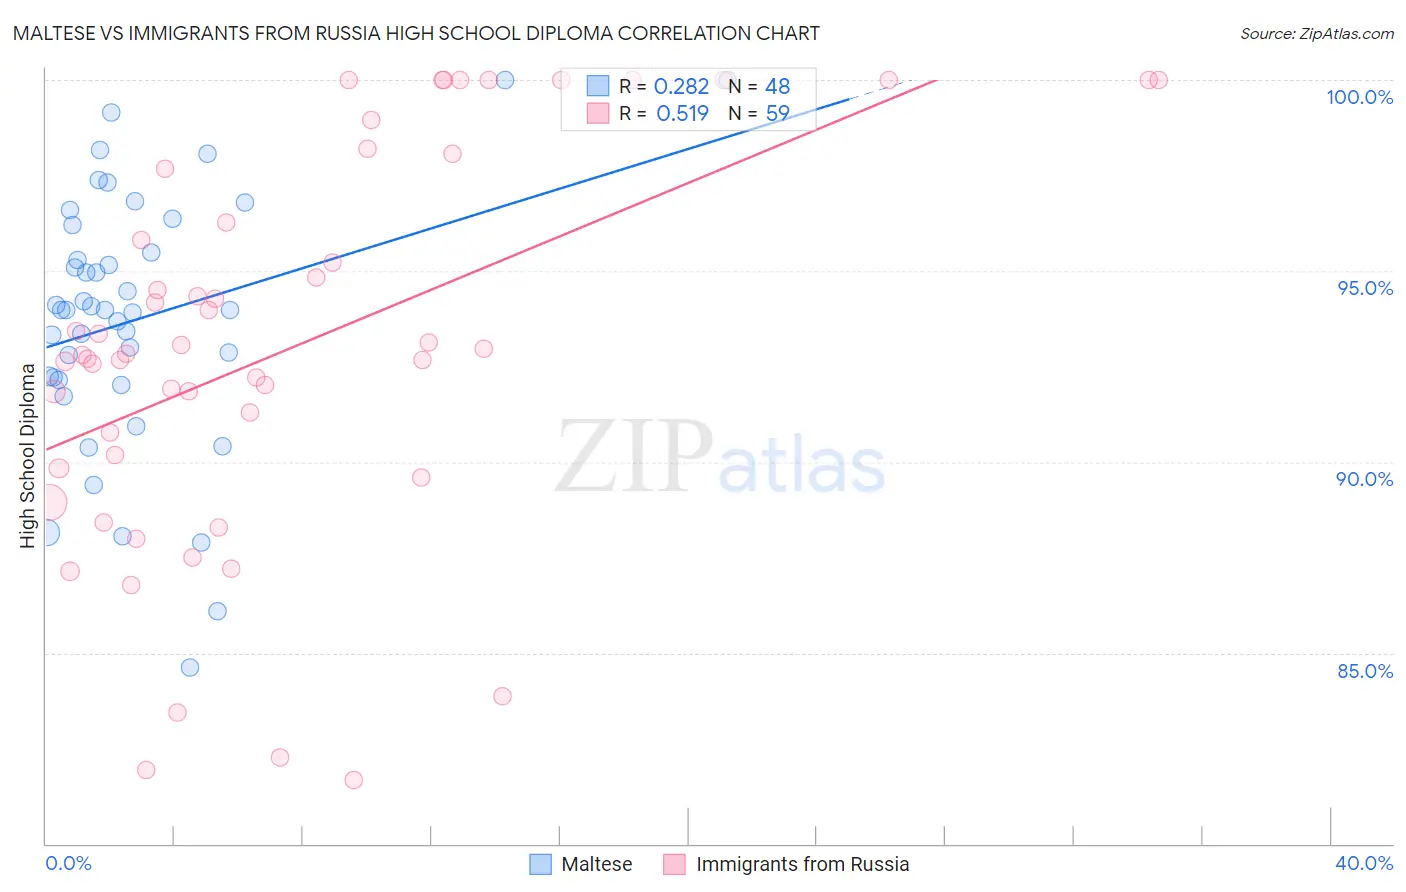
Maltese vs Immigrants from Russia High School Diploma Correlation Chart
The statistical analysis conducted on geographies consisting of 126,478,070 people shows a weak positive correlation between the proportion of Maltese and percentage of population with at least high school diploma education in the United States with a correlation coefficient (R) of 0.282 and weighted average of 91.6%. Similarly, the statistical analysis conducted on geographies consisting of 347,948,494 people shows a substantial positive correlation between the proportion of Immigrants from Russia and percentage of population with at least high school diploma education in the United States with a correlation coefficient (R) of 0.519 and weighted average of 90.3%, a difference of 1.5%.
High School Diploma Correlation Summary
| Measurement | Maltese | Immigrants from Russia |
| Minimum | 84.6% | 81.7% |
| Maximum | 100.0% | 100.0% |
| Range | 15.4% | 18.3% |
| Mean | 93.7% | 93.0% |
| Median | 94.0% | 92.8% |
| Interquartile 25% (IQ1) | 92.2% | 89.8% |
| Interquartile 75% (IQ3) | 95.9% | 97.7% |
| Interquartile Range (IQR) | 3.7% | 7.8% |
| Standard Deviation (Sample) | 3.4% | 5.1% |
| Standard Deviation (Population) | 3.3% | 5.0% |
Similar Demographics by High School Diploma
Demographics Similar to Maltese by High School Diploma
In terms of high school diploma, the demographic groups most similar to Maltese are Czech (91.6%, a difference of 0.030%), Filipino (91.6%, a difference of 0.040%), Estonian (91.6%, a difference of 0.050%), Immigrants from Singapore (91.7%, a difference of 0.080%), and German (91.7%, a difference of 0.080%).
| Demographics | Rating | Rank | High School Diploma |
| Poles | 100.0 /100 | #12 | Exceptional 91.9% |
| Danes | 100.0 /100 | #13 | Exceptional 91.8% |
| Bulgarians | 100.0 /100 | #14 | Exceptional 91.8% |
| Luxembourgers | 100.0 /100 | #15 | Exceptional 91.7% |
| Finns | 100.0 /100 | #16 | Exceptional 91.7% |
| Immigrants | Singapore | 99.9 /100 | #17 | Exceptional 91.7% |
| Germans | 99.9 /100 | #18 | Exceptional 91.7% |
| Maltese | 99.9 /100 | #19 | Exceptional 91.6% |
| Czechs | 99.9 /100 | #20 | Exceptional 91.6% |
| Filipinos | 99.9 /100 | #21 | Exceptional 91.6% |
| Estonians | 99.9 /100 | #22 | Exceptional 91.6% |
| Scandinavians | 99.9 /100 | #23 | Exceptional 91.5% |
| Italians | 99.9 /100 | #24 | Exceptional 91.5% |
| Thais | 99.9 /100 | #25 | Exceptional 91.5% |
| Russians | 99.9 /100 | #26 | Exceptional 91.5% |
Demographics Similar to Immigrants from Russia by High School Diploma
In terms of high school diploma, the demographic groups most similar to Immigrants from Russia are Syrian (90.3%, a difference of 0.020%), Palestinian (90.3%, a difference of 0.020%), Immigrants from Zimbabwe (90.3%, a difference of 0.020%), Immigrants from Greece (90.3%, a difference of 0.030%), and Menominee (90.3%, a difference of 0.030%).
| Demographics | Rating | Rank | High School Diploma |
| Immigrants | North Macedonia | 98.1 /100 | #100 | Exceptional 90.5% |
| Immigrants | Norway | 98.0 /100 | #101 | Exceptional 90.5% |
| Aleuts | 98.0 /100 | #102 | Exceptional 90.4% |
| Immigrants | Romania | 97.8 /100 | #103 | Exceptional 90.4% |
| Immigrants | Croatia | 97.8 /100 | #104 | Exceptional 90.4% |
| Lebanese | 97.4 /100 | #105 | Exceptional 90.4% |
| Syrians | 97.0 /100 | #106 | Exceptional 90.3% |
| Immigrants | Russia | 96.9 /100 | #107 | Exceptional 90.3% |
| Palestinians | 96.7 /100 | #108 | Exceptional 90.3% |
| Immigrants | Zimbabwe | 96.7 /100 | #109 | Exceptional 90.3% |
| Immigrants | Greece | 96.6 /100 | #110 | Exceptional 90.3% |
| Menominee | 96.6 /100 | #111 | Exceptional 90.3% |
| Immigrants | Belarus | 96.4 /100 | #112 | Exceptional 90.2% |
| Immigrants | Sri Lanka | 96.3 /100 | #113 | Exceptional 90.2% |
| Yugoslavians | 96.2 /100 | #114 | Exceptional 90.2% |