Maltese vs Immigrants from Liberia High School Diploma
COMPARE
Maltese
Immigrants from Liberia
High School Diploma
High School Diploma Comparison
Maltese
Immigrants from Liberia
91.6%
HIGH SCHOOL DIPLOMA
99.9/ 100
METRIC RATING
19th/ 347
METRIC RANK
88.2%
HIGH SCHOOL DIPLOMA
5.5/ 100
METRIC RATING
227th/ 347
METRIC RANK
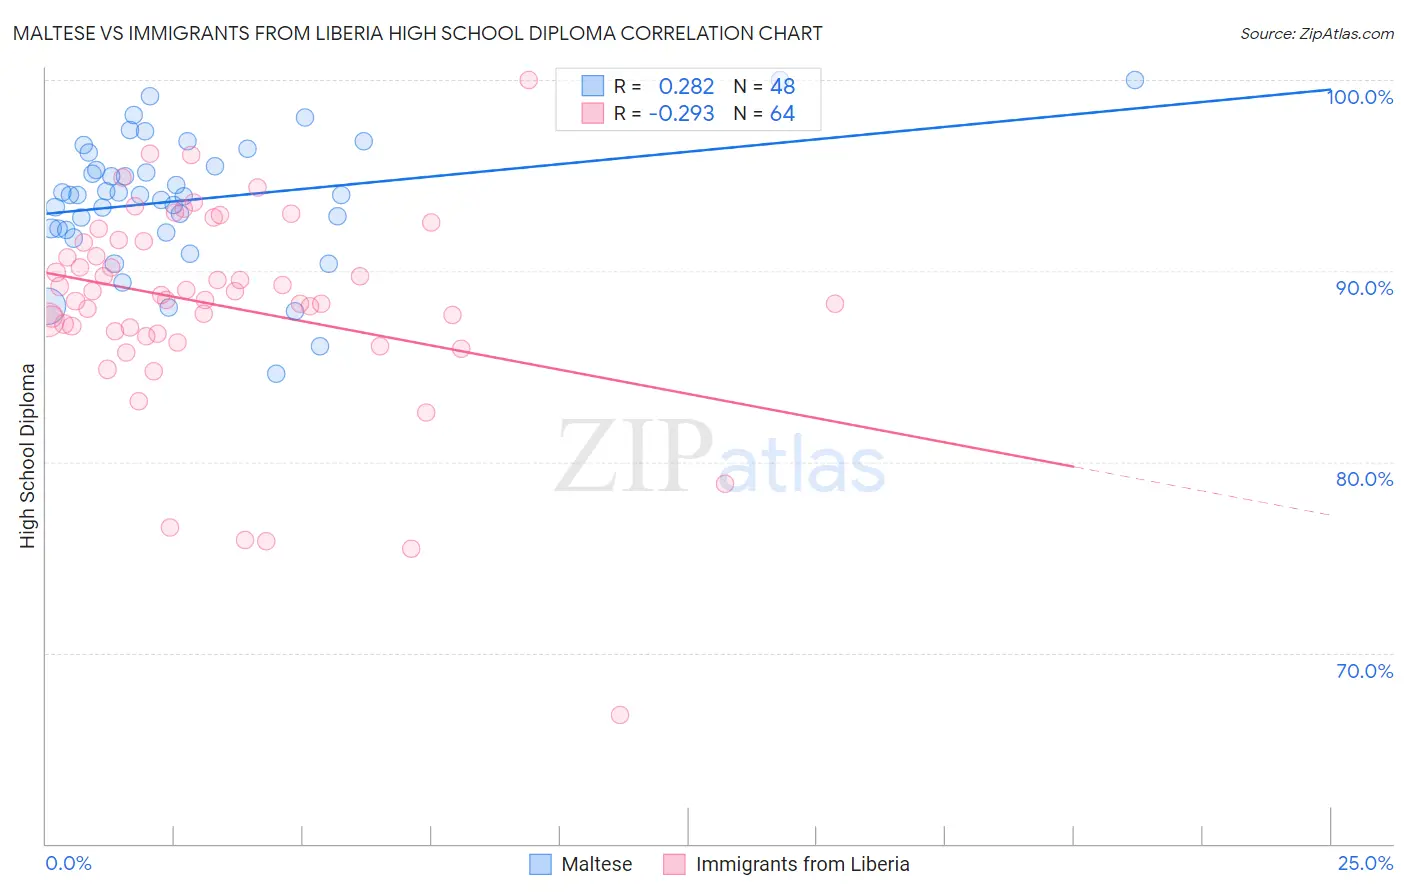
Maltese vs Immigrants from Liberia High School Diploma Correlation Chart
The statistical analysis conducted on geographies consisting of 126,478,070 people shows a weak positive correlation between the proportion of Maltese and percentage of population with at least high school diploma education in the United States with a correlation coefficient (R) of 0.282 and weighted average of 91.6%. Similarly, the statistical analysis conducted on geographies consisting of 135,293,967 people shows a weak negative correlation between the proportion of Immigrants from Liberia and percentage of population with at least high school diploma education in the United States with a correlation coefficient (R) of -0.293 and weighted average of 88.2%, a difference of 3.9%.
High School Diploma Correlation Summary
| Measurement | Maltese | Immigrants from Liberia |
| Minimum | 84.6% | 66.8% |
| Maximum | 100.0% | 100.0% |
| Range | 15.4% | 33.2% |
| Mean | 93.7% | 88.2% |
| Median | 94.0% | 88.6% |
| Interquartile 25% (IQ1) | 92.2% | 86.8% |
| Interquartile 75% (IQ3) | 95.9% | 91.5% |
| Interquartile Range (IQR) | 3.7% | 4.7% |
| Standard Deviation (Sample) | 3.4% | 5.5% |
| Standard Deviation (Population) | 3.3% | 5.4% |
Similar Demographics by High School Diploma
Demographics Similar to Maltese by High School Diploma
In terms of high school diploma, the demographic groups most similar to Maltese are Czech (91.6%, a difference of 0.030%), Filipino (91.6%, a difference of 0.040%), Estonian (91.6%, a difference of 0.050%), Immigrants from Singapore (91.7%, a difference of 0.080%), and German (91.7%, a difference of 0.080%).
| Demographics | Rating | Rank | High School Diploma |
| Poles | 100.0 /100 | #12 | Exceptional 91.9% |
| Danes | 100.0 /100 | #13 | Exceptional 91.8% |
| Bulgarians | 100.0 /100 | #14 | Exceptional 91.8% |
| Luxembourgers | 100.0 /100 | #15 | Exceptional 91.7% |
| Finns | 100.0 /100 | #16 | Exceptional 91.7% |
| Immigrants | Singapore | 99.9 /100 | #17 | Exceptional 91.7% |
| Germans | 99.9 /100 | #18 | Exceptional 91.7% |
| Maltese | 99.9 /100 | #19 | Exceptional 91.6% |
| Czechs | 99.9 /100 | #20 | Exceptional 91.6% |
| Filipinos | 99.9 /100 | #21 | Exceptional 91.6% |
| Estonians | 99.9 /100 | #22 | Exceptional 91.6% |
| Scandinavians | 99.9 /100 | #23 | Exceptional 91.5% |
| Italians | 99.9 /100 | #24 | Exceptional 91.5% |
| Thais | 99.9 /100 | #25 | Exceptional 91.5% |
| Russians | 99.9 /100 | #26 | Exceptional 91.5% |
Demographics Similar to Immigrants from Liberia by High School Diploma
In terms of high school diploma, the demographic groups most similar to Immigrants from Liberia are Uruguayan (88.2%, a difference of 0.010%), Kiowa (88.2%, a difference of 0.010%), Nigerian (88.2%, a difference of 0.020%), Creek (88.3%, a difference of 0.090%), and Shoshone (88.3%, a difference of 0.10%).
| Demographics | Rating | Rank | High School Diploma |
| Tongans | 9.5 /100 | #220 | Tragic 88.4% |
| Immigrants | Afghanistan | 8.6 /100 | #221 | Tragic 88.3% |
| Colville | 7.8 /100 | #222 | Tragic 88.3% |
| Immigrants | Zaire | 7.6 /100 | #223 | Tragic 88.3% |
| Shoshone | 7.0 /100 | #224 | Tragic 88.3% |
| Creek | 6.9 /100 | #225 | Tragic 88.3% |
| Uruguayans | 5.6 /100 | #226 | Tragic 88.2% |
| Immigrants | Liberia | 5.5 /100 | #227 | Tragic 88.2% |
| Kiowa | 5.3 /100 | #228 | Tragic 88.2% |
| Nigerians | 5.2 /100 | #229 | Tragic 88.2% |
| Blackfeet | 4.2 /100 | #230 | Tragic 88.1% |
| Colombians | 3.8 /100 | #231 | Tragic 88.1% |
| Immigrants | Middle Africa | 3.4 /100 | #232 | Tragic 88.0% |
| Immigrants | Panama | 3.1 /100 | #233 | Tragic 88.0% |
| Immigrants | Thailand | 3.1 /100 | #234 | Tragic 88.0% |