Maltese vs Immigrants from Cameroon High School Diploma
COMPARE
Maltese
Immigrants from Cameroon
High School Diploma
High School Diploma Comparison
Maltese
Immigrants from Cameroon
91.6%
HIGH SCHOOL DIPLOMA
99.9/ 100
METRIC RATING
19th/ 347
METRIC RANK
88.4%
HIGH SCHOOL DIPLOMA
10.9/ 100
METRIC RATING
214th/ 347
METRIC RANK
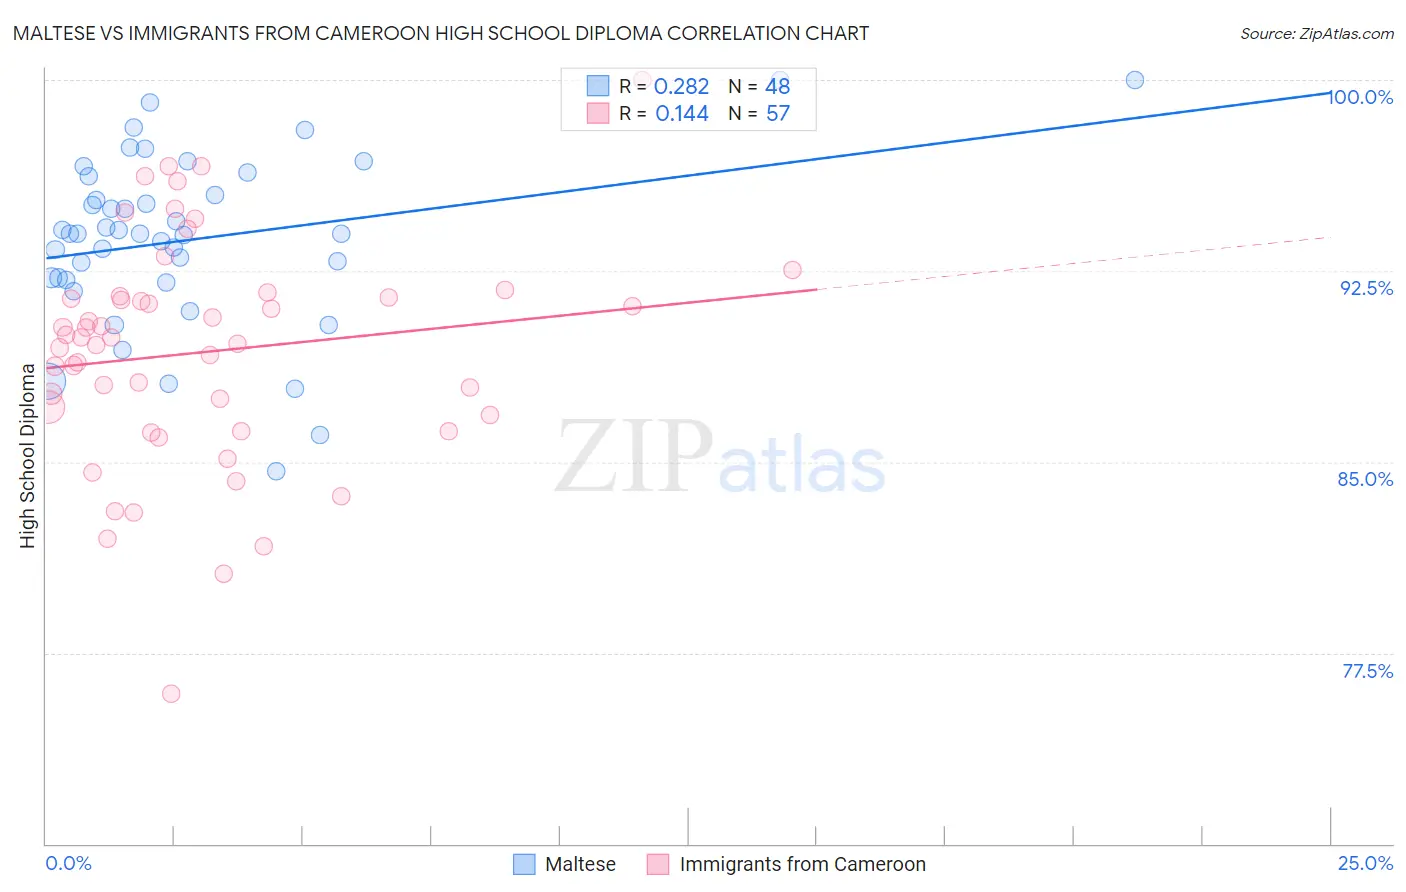
Maltese vs Immigrants from Cameroon High School Diploma Correlation Chart
The statistical analysis conducted on geographies consisting of 126,478,070 people shows a weak positive correlation between the proportion of Maltese and percentage of population with at least high school diploma education in the United States with a correlation coefficient (R) of 0.282 and weighted average of 91.6%. Similarly, the statistical analysis conducted on geographies consisting of 130,618,704 people shows a poor positive correlation between the proportion of Immigrants from Cameroon and percentage of population with at least high school diploma education in the United States with a correlation coefficient (R) of 0.144 and weighted average of 88.4%, a difference of 3.6%.
High School Diploma Correlation Summary
| Measurement | Maltese | Immigrants from Cameroon |
| Minimum | 84.6% | 75.9% |
| Maximum | 100.0% | 100.0% |
| Range | 15.4% | 24.1% |
| Mean | 93.7% | 89.3% |
| Median | 94.0% | 89.9% |
| Interquartile 25% (IQ1) | 92.2% | 86.5% |
| Interquartile 75% (IQ3) | 95.9% | 91.5% |
| Interquartile Range (IQR) | 3.7% | 4.9% |
| Standard Deviation (Sample) | 3.4% | 4.5% |
| Standard Deviation (Population) | 3.3% | 4.4% |
Similar Demographics by High School Diploma
Demographics Similar to Maltese by High School Diploma
In terms of high school diploma, the demographic groups most similar to Maltese are Czech (91.6%, a difference of 0.030%), Filipino (91.6%, a difference of 0.040%), Estonian (91.6%, a difference of 0.050%), Immigrants from Singapore (91.7%, a difference of 0.080%), and German (91.7%, a difference of 0.080%).
| Demographics | Rating | Rank | High School Diploma |
| Poles | 100.0 /100 | #12 | Exceptional 91.9% |
| Danes | 100.0 /100 | #13 | Exceptional 91.8% |
| Bulgarians | 100.0 /100 | #14 | Exceptional 91.8% |
| Luxembourgers | 100.0 /100 | #15 | Exceptional 91.7% |
| Finns | 100.0 /100 | #16 | Exceptional 91.7% |
| Immigrants | Singapore | 99.9 /100 | #17 | Exceptional 91.7% |
| Germans | 99.9 /100 | #18 | Exceptional 91.7% |
| Maltese | 99.9 /100 | #19 | Exceptional 91.6% |
| Czechs | 99.9 /100 | #20 | Exceptional 91.6% |
| Filipinos | 99.9 /100 | #21 | Exceptional 91.6% |
| Estonians | 99.9 /100 | #22 | Exceptional 91.6% |
| Scandinavians | 99.9 /100 | #23 | Exceptional 91.5% |
| Italians | 99.9 /100 | #24 | Exceptional 91.5% |
| Thais | 99.9 /100 | #25 | Exceptional 91.5% |
| Russians | 99.9 /100 | #26 | Exceptional 91.5% |
Demographics Similar to Immigrants from Cameroon by High School Diploma
In terms of high school diploma, the demographic groups most similar to Immigrants from Cameroon are Crow (88.4%, a difference of 0.0%), Immigrants from Somalia (88.4%, a difference of 0.010%), Chickasaw (88.4%, a difference of 0.010%), Immigrants from Africa (88.4%, a difference of 0.010%), and Immigrants from Bolivia (88.4%, a difference of 0.030%).
| Demographics | Rating | Rank | High School Diploma |
| Immigrants | Sierra Leone | 15.8 /100 | #207 | Poor 88.6% |
| Portuguese | 14.4 /100 | #208 | Poor 88.5% |
| Cherokee | 14.3 /100 | #209 | Poor 88.5% |
| Samoans | 14.0 /100 | #210 | Poor 88.5% |
| Inupiat | 13.1 /100 | #211 | Poor 88.5% |
| South American Indians | 12.2 /100 | #212 | Poor 88.5% |
| Immigrants | Somalia | 11.3 /100 | #213 | Poor 88.4% |
| Immigrants | Cameroon | 10.9 /100 | #214 | Poor 88.4% |
| Crow | 10.9 /100 | #215 | Poor 88.4% |
| Chickasaw | 10.7 /100 | #216 | Poor 88.4% |
| Immigrants | Africa | 10.6 /100 | #217 | Poor 88.4% |
| Immigrants | Bolivia | 10.3 /100 | #218 | Poor 88.4% |
| Costa Ricans | 9.6 /100 | #219 | Tragic 88.4% |
| Tongans | 9.5 /100 | #220 | Tragic 88.4% |
| Immigrants | Afghanistan | 8.6 /100 | #221 | Tragic 88.3% |