Maltese vs Cree High School Diploma
COMPARE
Maltese
Cree
High School Diploma
High School Diploma Comparison
Maltese
Cree
91.6%
HIGH SCHOOL DIPLOMA
99.9/ 100
METRIC RATING
19th/ 347
METRIC RANK
89.3%
HIGH SCHOOL DIPLOMA
61.1/ 100
METRIC RATING
163rd/ 347
METRIC RANK
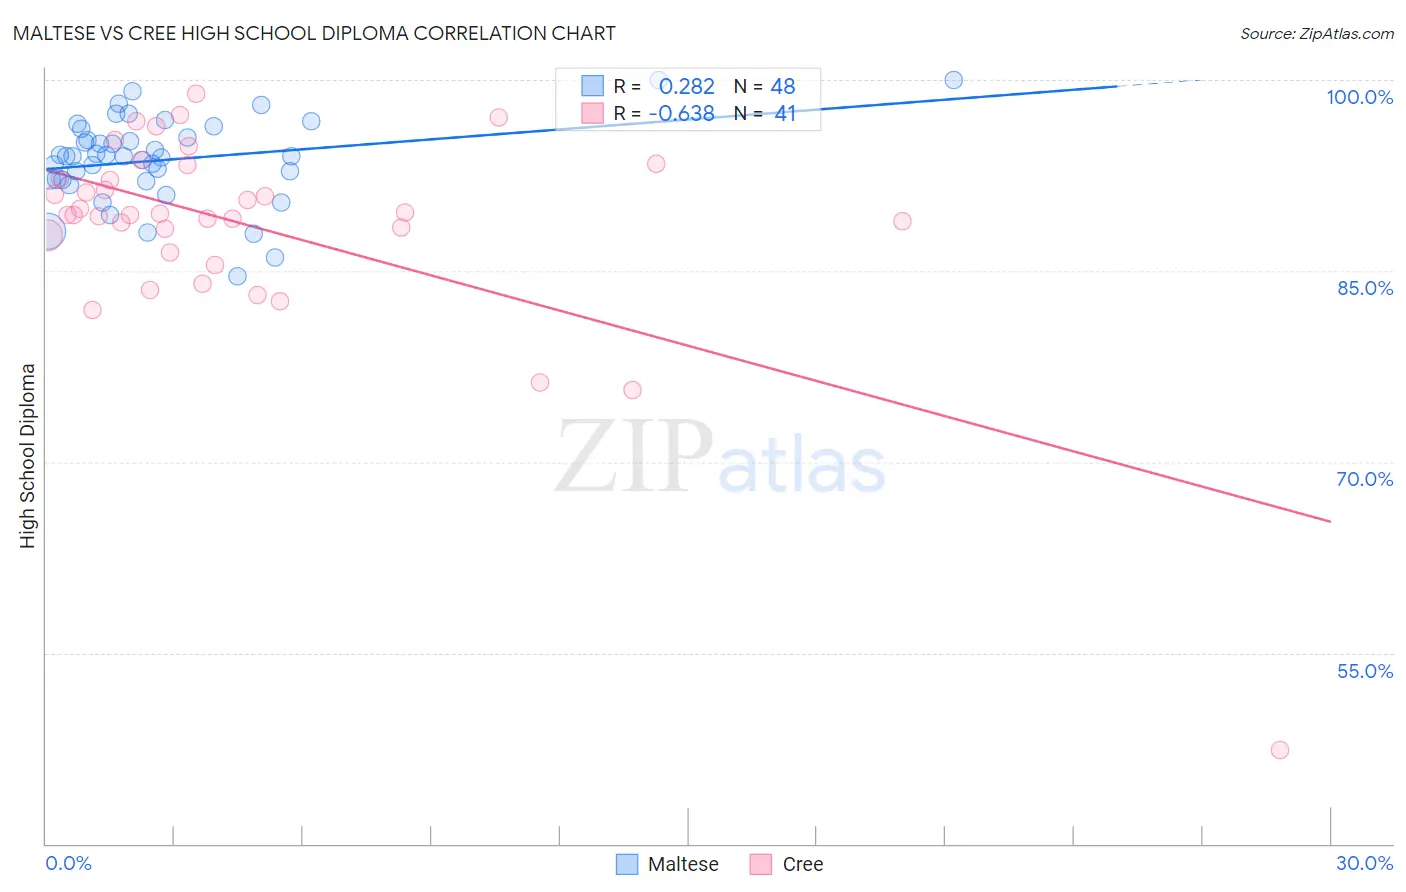
Maltese vs Cree High School Diploma Correlation Chart
The statistical analysis conducted on geographies consisting of 126,478,070 people shows a weak positive correlation between the proportion of Maltese and percentage of population with at least high school diploma education in the United States with a correlation coefficient (R) of 0.282 and weighted average of 91.6%. Similarly, the statistical analysis conducted on geographies consisting of 76,211,744 people shows a significant negative correlation between the proportion of Cree and percentage of population with at least high school diploma education in the United States with a correlation coefficient (R) of -0.638 and weighted average of 89.3%, a difference of 2.6%.
High School Diploma Correlation Summary
| Measurement | Maltese | Cree |
| Minimum | 84.6% | 47.4% |
| Maximum | 100.0% | 98.9% |
| Range | 15.4% | 51.6% |
| Mean | 93.7% | 88.5% |
| Median | 94.0% | 89.4% |
| Interquartile 25% (IQ1) | 92.2% | 87.1% |
| Interquartile 75% (IQ3) | 95.9% | 92.8% |
| Interquartile Range (IQR) | 3.7% | 5.7% |
| Standard Deviation (Sample) | 3.4% | 8.3% |
| Standard Deviation (Population) | 3.3% | 8.2% |
Similar Demographics by High School Diploma
Demographics Similar to Maltese by High School Diploma
In terms of high school diploma, the demographic groups most similar to Maltese are Czech (91.6%, a difference of 0.030%), Filipino (91.6%, a difference of 0.040%), Estonian (91.6%, a difference of 0.050%), Immigrants from Singapore (91.7%, a difference of 0.080%), and German (91.7%, a difference of 0.080%).
| Demographics | Rating | Rank | High School Diploma |
| Poles | 100.0 /100 | #12 | Exceptional 91.9% |
| Danes | 100.0 /100 | #13 | Exceptional 91.8% |
| Bulgarians | 100.0 /100 | #14 | Exceptional 91.8% |
| Luxembourgers | 100.0 /100 | #15 | Exceptional 91.7% |
| Finns | 100.0 /100 | #16 | Exceptional 91.7% |
| Immigrants | Singapore | 99.9 /100 | #17 | Exceptional 91.7% |
| Germans | 99.9 /100 | #18 | Exceptional 91.7% |
| Maltese | 99.9 /100 | #19 | Exceptional 91.6% |
| Czechs | 99.9 /100 | #20 | Exceptional 91.6% |
| Filipinos | 99.9 /100 | #21 | Exceptional 91.6% |
| Estonians | 99.9 /100 | #22 | Exceptional 91.6% |
| Scandinavians | 99.9 /100 | #23 | Exceptional 91.5% |
| Italians | 99.9 /100 | #24 | Exceptional 91.5% |
| Thais | 99.9 /100 | #25 | Exceptional 91.5% |
| Russians | 99.9 /100 | #26 | Exceptional 91.5% |
Demographics Similar to Cree by High School Diploma
In terms of high school diploma, the demographic groups most similar to Cree are Brazilian (89.3%, a difference of 0.0%), Bermudan (89.3%, a difference of 0.0%), Immigrants from Nepal (89.3%, a difference of 0.0%), Immigrants from China (89.3%, a difference of 0.010%), and Laotian (89.3%, a difference of 0.010%).
| Demographics | Rating | Rank | High School Diploma |
| Immigrants | Argentina | 65.5 /100 | #156 | Good 89.4% |
| Immigrants | Malaysia | 63.5 /100 | #157 | Good 89.3% |
| Immigrants | Pakistan | 62.5 /100 | #158 | Good 89.3% |
| Immigrants | China | 62.0 /100 | #159 | Good 89.3% |
| Laotians | 61.8 /100 | #160 | Good 89.3% |
| Brazilians | 61.2 /100 | #161 | Good 89.3% |
| Bermudans | 61.1 /100 | #162 | Good 89.3% |
| Cree | 61.1 /100 | #163 | Good 89.3% |
| Immigrants | Nepal | 61.1 /100 | #164 | Good 89.3% |
| Immigrants | Asia | 59.8 /100 | #165 | Average 89.3% |
| Immigrants | Albania | 59.4 /100 | #166 | Average 89.3% |
| Immigrants | Hong Kong | 58.6 /100 | #167 | Average 89.3% |
| Delaware | 55.8 /100 | #168 | Average 89.2% |
| Iroquois | 55.1 /100 | #169 | Average 89.2% |
| Immigrants | Morocco | 53.3 /100 | #170 | Average 89.2% |