Maltese vs Icelander High School Diploma

COMPARE

Maltese
Race
Ancestry
AfghanAfricanAlaska NativeAlaskan AthabascanAlbanianAleutAlsatianAmericanApacheArabArapahoArgentineanArmenianAssyrian/Chaldean/SyriacAustralianAustrianBahamianBangladeshiBarbadianBasqueBelgianBelizeanBermudanBhutaneseBlackfeetBolivianBrazilianBritishBritish West IndianBulgarianBurmeseCajunCambodianCanadianCape VerdeanCarpatho RusynCelticCentral AmericanCentral American IndianCherokeeCheyenneChickasawChileanChineseChippewaChoctawColombianColvilleComancheCosta RicanCreeCreekCroatianCrowCubanCypriotCzechCzechoslovakianDanishDelawareDominicanDutchDutch West IndianEastern EuropeanEcuadorianEgyptianEnglishEstonianEthiopianEuropeanFijianFilipinoFinnishFrenchFrench American IndianFrench CanadianGermanGerman RussianGhanaianGreekGuamanian/ChamorroGuatemalanGuyaneseHaitianHmongHonduranHopiHoumaHungarianIndian (Asian)IndonesianInupiatIranianIraqiIrishIroquoisIsraeliItalianJamaicanJapaneseJordanianKenyanKiowaKoreanLaotianLatvianLebaneseLiberianLithuanianLumbeeLuxembourgerMacedonianMalaysianMalteseMarshalleseMenomineeMexicanMexican American IndianMongolianMoroccanNative HawaiianNavajoNepaleseNew ZealanderNicaraguanNigerianNorthern EuropeanNorwegianOkinawanOsageOttawaPaiutePakistaniPalestinianPanamanianParaguayanPennsylvania GermanPeruvianPimaPolishPortuguesePotawatomiPuebloPuerto RicanPuget Sound SalishRomanianRussianSalvadoranSamoanScandinavianScotch-IrishScottishSeminoleSenegaleseSerbianShoshoneSierra LeoneanSiouxSlavicSlovakSloveneSomaliSouth AfricanSouth AmericanSouth American IndianSoviet UnionSpaniardSpanishSpanish AmericanSpanish American IndianSri LankanSubsaharan AfricanSudaneseSwedishSwissSyrianTaiwaneseThaiTlingit-HaidaTohono O'OdhamTonganTrinidadian and TobagonianTsimshianTurkishU.S. Virgin IslanderUgandanUkrainianUruguayanUteVenezuelanVietnameseWelshWest IndianYakamaYaquiYugoslavianYumanYup'ikZimbabwean
Immigration
NonimmigrantsImmigrantsAfghanistanAfricaAlbaniaArgentinaArmeniaAsiaAustraliaAustriaBahamasBangladeshBarbadosBelarusBelgiumBelizeBoliviaBosnia and HerzegovinaBrazilBulgariaBurma/MyanmarCabo VerdeCambodiaCameroonCanadaCaribbeanCentral AmericaChileChinaColombiaCongoCosta RicaCroatiaCubaCzechoslovakiaDenmarkDominicaDominican RepublicEastern AfricaEastern AsiaEastern EuropeEcuadorEgyptEl SalvadorEnglandEritreaEthiopiaEuropeFijiFranceGermanyGhanaGreeceGrenadaGuatemalaGuyanaHaitiHondurasHong KongHungaryIndiaIndonesiaIranIraqIrelandIsraelItalyJamaicaJapanJordanKazakhstanKenyaKoreaKuwaitLaosLatin AmericaLatviaLebanonLiberiaLithuaniaMalaysiaMexicoMicronesiaMiddle AfricaMoldovaMoroccoNepalNetherlandsNicaraguaNigeriaNorth AmericaNorth MacedoniaNorthern AfricaNorthern EuropeNorwayOceaniaPakistanPanamaPeruPhilippinesPolandPortugalRomaniaRussiaSaudi ArabiaScotlandSenegalSerbiaSierra LeoneSingaporeSomaliaSouth AfricaSouth AmericaSouth Central AsiaSouth Eastern AsiaSouthern EuropeSpainSri LankaSt. Vincent and the GrenadinesSudanSwedenSwitzerlandSyriaTaiwanThailandTrinidad and TobagoTurkeyUgandaUkraineUruguayUzbekistanVenezuelaVietnamWest IndiesWestern AfricaWestern AsiaWestern EuropeYemenZaireZimbabweAzores
Icelander
Race
Ancestry
AfghanAfricanAlaska NativeAlaskan AthabascanAlbanianAleutAlsatianAmericanApacheArabArapahoArgentineanArmenianAssyrian/Chaldean/SyriacAustralianAustrianBahamianBangladeshiBarbadianBasqueBelgianBelizeanBermudanBhutaneseBlackfeetBolivianBrazilianBritishBritish West IndianBulgarianBurmeseCajunCambodianCanadianCape VerdeanCarpatho RusynCelticCentral AmericanCentral American IndianCherokeeCheyenneChickasawChileanChineseChippewaChoctawColombianColvilleComancheCosta RicanCreeCreekCroatianCrowCubanCypriotCzechCzechoslovakianDanishDelawareDominicanDutchDutch West IndianEastern EuropeanEcuadorianEgyptianEnglishEstonianEthiopianEuropeanFijianFilipinoFinnishFrenchFrench American IndianFrench CanadianGermanGerman RussianGhanaianGreekGuamanian/ChamorroGuatemalanGuyaneseHaitianHmongHonduranHopiHoumaHungarianIcelanderIndian (Asian)IndonesianInupiatIranianIraqiIrishIroquoisIsraeliItalianJamaicanJapaneseJordanianKenyanKiowaKoreanLaotianLatvianLebaneseLiberianLithuanianLumbeeLuxembourgerMacedonianMalaysianMarshalleseMenomineeMexicanMexican American IndianMongolianMoroccanNative HawaiianNavajoNepaleseNew ZealanderNicaraguanNigerianNorthern EuropeanNorwegianOkinawanOsageOttawaPaiutePakistaniPalestinianPanamanianParaguayanPennsylvania GermanPeruvianPimaPolishPortuguesePotawatomiPuebloPuerto RicanPuget Sound SalishRomanianRussianSalvadoranSamoanScandinavianScotch-IrishScottishSeminoleSenegaleseSerbianShoshoneSierra LeoneanSiouxSlavicSlovakSloveneSomaliSouth AfricanSouth AmericanSouth American IndianSoviet UnionSpaniardSpanishSpanish AmericanSpanish American IndianSri LankanSubsaharan AfricanSudaneseSwedishSwissSyrianTaiwaneseThaiTlingit-HaidaTohono O'OdhamTonganTrinidadian and TobagonianTsimshianTurkishU.S. Virgin IslanderUgandanUkrainianUruguayanUteVenezuelanVietnameseWelshWest IndianYakamaYaquiYugoslavianYumanYup'ikZimbabwean
Immigration
NonimmigrantsImmigrantsAfghanistanAfricaAlbaniaArgentinaArmeniaAsiaAustraliaAustriaBahamasBangladeshBarbadosBelarusBelgiumBelizeBoliviaBosnia and HerzegovinaBrazilBulgariaBurma/MyanmarCabo VerdeCambodiaCameroonCanadaCaribbeanCentral AmericaChileChinaColombiaCongoCosta RicaCroatiaCubaCzechoslovakiaDenmarkDominicaDominican RepublicEastern AfricaEastern AsiaEastern EuropeEcuadorEgyptEl SalvadorEnglandEritreaEthiopiaEuropeFijiFranceGermanyGhanaGreeceGrenadaGuatemalaGuyanaHaitiHondurasHong KongHungaryIndiaIndonesiaIranIraqIrelandIsraelItalyJamaicaJapanJordanKazakhstanKenyaKoreaKuwaitLaosLatin AmericaLatviaLebanonLiberiaLithuaniaMalaysiaMexicoMicronesiaMiddle AfricaMoldovaMoroccoNepalNetherlandsNicaraguaNigeriaNorth AmericaNorth MacedoniaNorthern AfricaNorthern EuropeNorwayOceaniaPakistanPanamaPeruPhilippinesPolandPortugalRomaniaRussiaSaudi ArabiaScotlandSenegalSerbiaSierra LeoneSingaporeSomaliaSouth AfricaSouth AmericaSouth Central AsiaSouth Eastern AsiaSouthern EuropeSpainSri LankaSt. Vincent and the GrenadinesSudanSwedenSwitzerlandSyriaTaiwanThailandTrinidad and TobagoTurkeyUgandaUkraineUruguayUzbekistanVenezuelaVietnamWest IndiesWestern AfricaWestern AsiaWestern EuropeYemenZaireZimbabweAzores
High School Diploma
Income
Poverty
Unemployment
Labor Participation
Family Structure
Vehicle Availability
Education Level
Disability

High School Diploma Comparison

Maltese

Icelanders

Exceptional
Exceptional
91.6%
HIGH SCHOOL DIPLOMA
99.9/ 100
METRIC RATING
19th/ 347
METRIC RANK
90.5%
HIGH SCHOOL DIPLOMA
98.5/ 100
METRIC RATING
95th/ 347
METRIC RANK

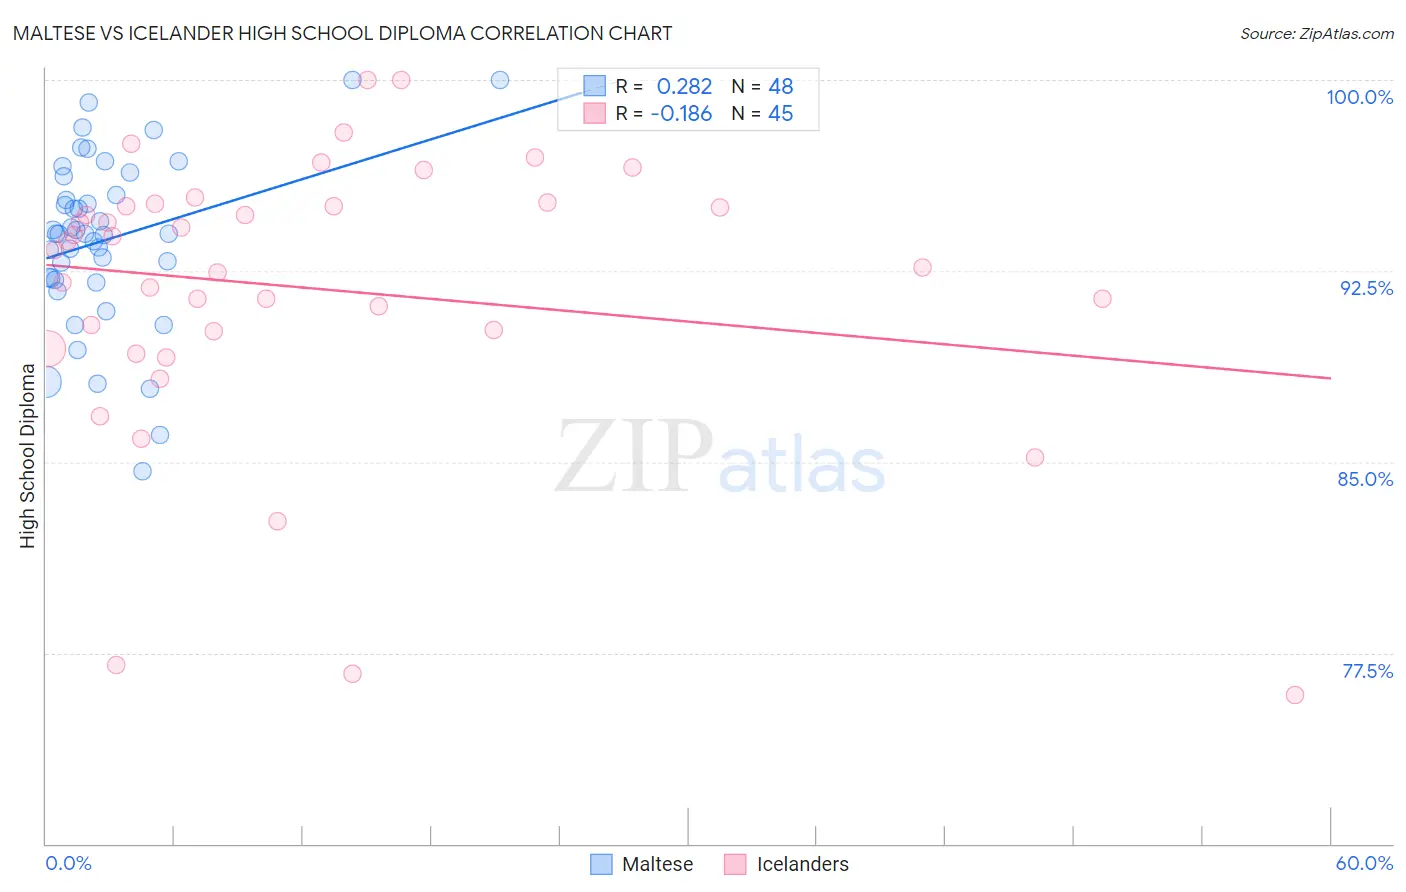
Maltese vs Icelander High School Diploma Correlation Chart

The statistical analysis conducted on geographies consisting of 126,478,070 people shows a weak positive correlation between the proportion of Maltese and percentage of population with at least high school diploma education in the United States with a correlation coefficient (R) of 0.282 and weighted average of 91.6%. Similarly, the statistical analysis conducted on geographies consisting of 159,668,816 people shows a poor negative correlation between the proportion of Icelanders and percentage of population with at least high school diploma education in the United States with a correlation coefficient (R) of -0.186 and weighted average of 90.5%, a difference of 1.2%.
Maltese vs Icelander High School Diploma

High School Diploma Correlation Summary

MeasurementMalteseIcelander
Minimum84.6%75.9%
Maximum100.0%100.0%
Range15.4%24.1%
Mean93.7%91.8%
Median94.0%93.3%
Interquartile 25% (IQ1)92.2%89.8%
Interquartile 75% (IQ3)95.9%95.1%
Interquartile Range (IQR)3.7%5.3%
Standard Deviation (Sample)3.4%5.5%
Standard Deviation (Population)3.3%5.5%

Similar Demographics by High School Diploma

Demographics Similar to Maltese by High School Diploma

In terms of high school diploma, the demographic groups most similar to Maltese are Czech (91.6%, a difference of 0.030%), Filipino (91.6%, a difference of 0.040%), Estonian (91.6%, a difference of 0.050%), Immigrants from Singapore (91.7%, a difference of 0.080%), and German (91.7%, a difference of 0.080%).
DemographicsRating | RankHigh School Diploma
Poles
100.0
/100
|
#12
Exceptional
91.9%
Danes
100.0
/100
|
#13
Exceptional
91.8%
Bulgarians
100.0
/100
|
#14
Exceptional
91.8%
Luxembourgers
100.0
/100
|
#15
Exceptional
91.7%
Finns
100.0
/100
|
#16
Exceptional
91.7%
Immigrants | Singapore
99.9
/100
|
#17
Exceptional
91.7%
Germans
99.9
/100
|
#18
Exceptional
91.7%
Maltese
99.9
/100
|
#19
Exceptional
91.6%
Czechs
99.9
/100
|
#20
Exceptional
91.6%
Filipinos
99.9
/100
|
#21
Exceptional
91.6%
Estonians
99.9
/100
|
#22
Exceptional
91.6%
Scandinavians
99.9
/100
|
#23
Exceptional
91.5%
Italians
99.9
/100
|
#24
Exceptional
91.5%
Thais
99.9
/100
|
#25
Exceptional
91.5%
Russians
99.9
/100
|
#26
Exceptional
91.5%

Demographics Similar to Icelanders by High School Diploma

In terms of high school diploma, the demographic groups most similar to Icelanders are Immigrants from Israel (90.5%, a difference of 0.0%), Immigrants from Serbia (90.5%, a difference of 0.010%), Immigrants from Western Europe (90.6%, a difference of 0.020%), Swiss (90.6%, a difference of 0.030%), and South African (90.6%, a difference of 0.040%).
DemographicsRating | RankHigh School Diploma
Immigrants | France
98.8
/100
|
#88
Exceptional
90.6%
Canadians
98.7
/100
|
#89
Exceptional
90.6%
Celtics
98.7
/100
|
#90
Exceptional
90.6%
South Africans
98.6
/100
|
#91
Exceptional
90.6%
Swiss
98.6
/100
|
#92
Exceptional
90.6%
Immigrants | Western Europe
98.6
/100
|
#93
Exceptional
90.6%
Immigrants | Israel
98.5
/100
|
#94
Exceptional
90.5%
Icelanders
98.5
/100
|
#95
Exceptional
90.5%
Immigrants | Serbia
98.4
/100
|
#96
Exceptional
90.5%
Immigrants | Kuwait
98.3
/100
|
#97
Exceptional
90.5%
Immigrants | Korea
98.3
/100
|
#98
Exceptional
90.5%
Immigrants | Europe
98.2
/100
|
#99
Exceptional
90.5%
Immigrants | North Macedonia
98.1
/100
|
#100
Exceptional
90.5%
Immigrants | Norway
98.0
/100
|
#101
Exceptional
90.5%
Aleuts
98.0
/100
|
#102
Exceptional
90.4%