Malaysian vs Mexican American Indian Doctorate Degree
COMPARE
Malaysian
Mexican American Indian
Doctorate Degree
Doctorate Degree Comparison
Malaysians
Mexican American Indians
1.5%
DOCTORATE DEGREE
0.3/ 100
METRIC RATING
285th/ 347
METRIC RANK
1.4%
DOCTORATE DEGREE
0.1/ 100
METRIC RATING
304th/ 347
METRIC RANK
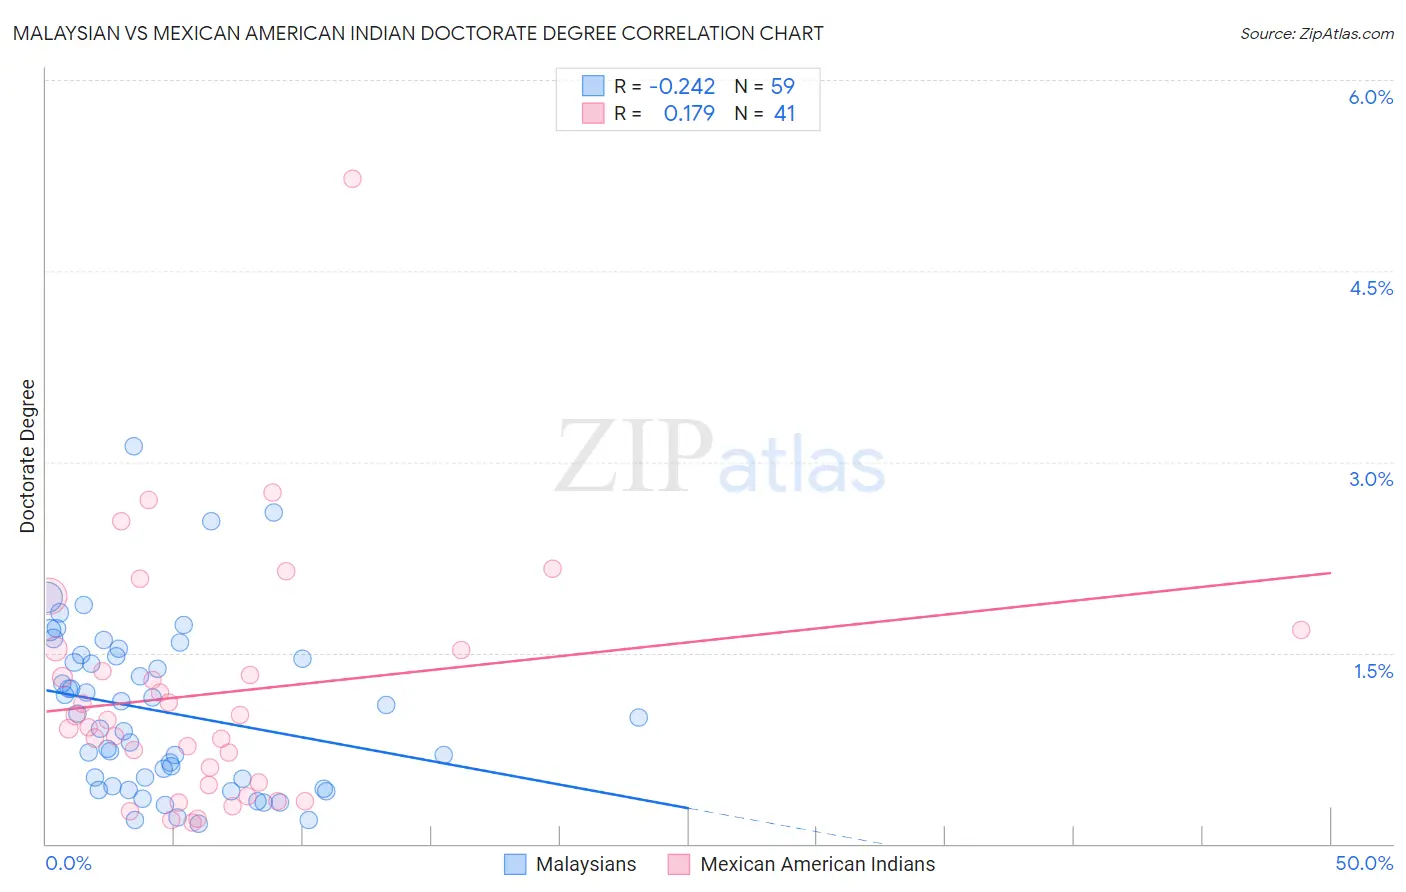
Malaysian vs Mexican American Indian Doctorate Degree Correlation Chart
The statistical analysis conducted on geographies consisting of 224,756,978 people shows a weak negative correlation between the proportion of Malaysians and percentage of population with at least doctorate degree education in the United States with a correlation coefficient (R) of -0.242 and weighted average of 1.5%. Similarly, the statistical analysis conducted on geographies consisting of 313,619,583 people shows a poor positive correlation between the proportion of Mexican American Indians and percentage of population with at least doctorate degree education in the United States with a correlation coefficient (R) of 0.179 and weighted average of 1.4%, a difference of 5.3%.
Doctorate Degree Correlation Summary
| Measurement | Malaysian | Mexican American Indian |
| Minimum | 0.16% | 0.17% |
| Maximum | 3.1% | 5.2% |
| Range | 3.0% | 5.1% |
| Mean | 1.0% | 1.2% |
| Median | 1.00% | 0.98% |
| Interquartile 25% (IQ1) | 0.45% | 0.47% |
| Interquartile 75% (IQ3) | 1.5% | 1.5% |
| Interquartile Range (IQR) | 1.0% | 1.1% |
| Standard Deviation (Sample) | 0.65% | 0.96% |
| Standard Deviation (Population) | 0.64% | 0.95% |
Demographics Similar to Malaysians and Mexican American Indians by Doctorate Degree
In terms of doctorate degree, the demographic groups most similar to Malaysians are Jamaican (1.5%, a difference of 0.030%), Cherokee (1.5%, a difference of 0.18%), Cajun (1.5%, a difference of 0.34%), Immigrants from El Salvador (1.4%, a difference of 0.52%), and Cape Verdean (1.4%, a difference of 0.66%). Similarly, the demographic groups most similar to Mexican American Indians are Immigrants from Dominica (1.4%, a difference of 0.060%), Shoshone (1.4%, a difference of 0.090%), Honduran (1.4%, a difference of 0.42%), Immigrants from Guatemala (1.4%, a difference of 0.48%), and Belizean (1.4%, a difference of 0.81%).
| Demographics | Rating | Rank | Doctorate Degree |
| Jamaicans | 0.3 /100 | #284 | Tragic 1.5% |
| Malaysians | 0.3 /100 | #285 | Tragic 1.5% |
| Cherokee | 0.3 /100 | #286 | Tragic 1.5% |
| Cajuns | 0.3 /100 | #287 | Tragic 1.5% |
| Immigrants | El Salvador | 0.3 /100 | #288 | Tragic 1.4% |
| Cape Verdeans | 0.3 /100 | #289 | Tragic 1.4% |
| Choctaw | 0.3 /100 | #290 | Tragic 1.4% |
| Blacks/African Americans | 0.3 /100 | #291 | Tragic 1.4% |
| Alaska Natives | 0.3 /100 | #292 | Tragic 1.4% |
| Immigrants | Yemen | 0.2 /100 | #293 | Tragic 1.4% |
| Samoans | 0.2 /100 | #294 | Tragic 1.4% |
| Guatemalans | 0.2 /100 | #295 | Tragic 1.4% |
| Immigrants | Ecuador | 0.2 /100 | #296 | Tragic 1.4% |
| Tsimshian | 0.2 /100 | #297 | Tragic 1.4% |
| Puerto Ricans | 0.1 /100 | #298 | Tragic 1.4% |
| Belizeans | 0.1 /100 | #299 | Tragic 1.4% |
| Immigrants | Guatemala | 0.1 /100 | #300 | Tragic 1.4% |
| Hondurans | 0.1 /100 | #301 | Tragic 1.4% |
| Shoshone | 0.1 /100 | #302 | Tragic 1.4% |
| Immigrants | Dominica | 0.1 /100 | #303 | Tragic 1.4% |
| Mexican American Indians | 0.1 /100 | #304 | Tragic 1.4% |