Malaysian vs Eastern European Doctorate Degree
COMPARE
Malaysian
Eastern European
Doctorate Degree
Doctorate Degree Comparison
Malaysians
Eastern Europeans
1.5%
DOCTORATE DEGREE
0.3/ 100
METRIC RATING
285th/ 347
METRIC RANK
2.8%
DOCTORATE DEGREE
100.0/ 100
METRIC RATING
16th/ 347
METRIC RANK
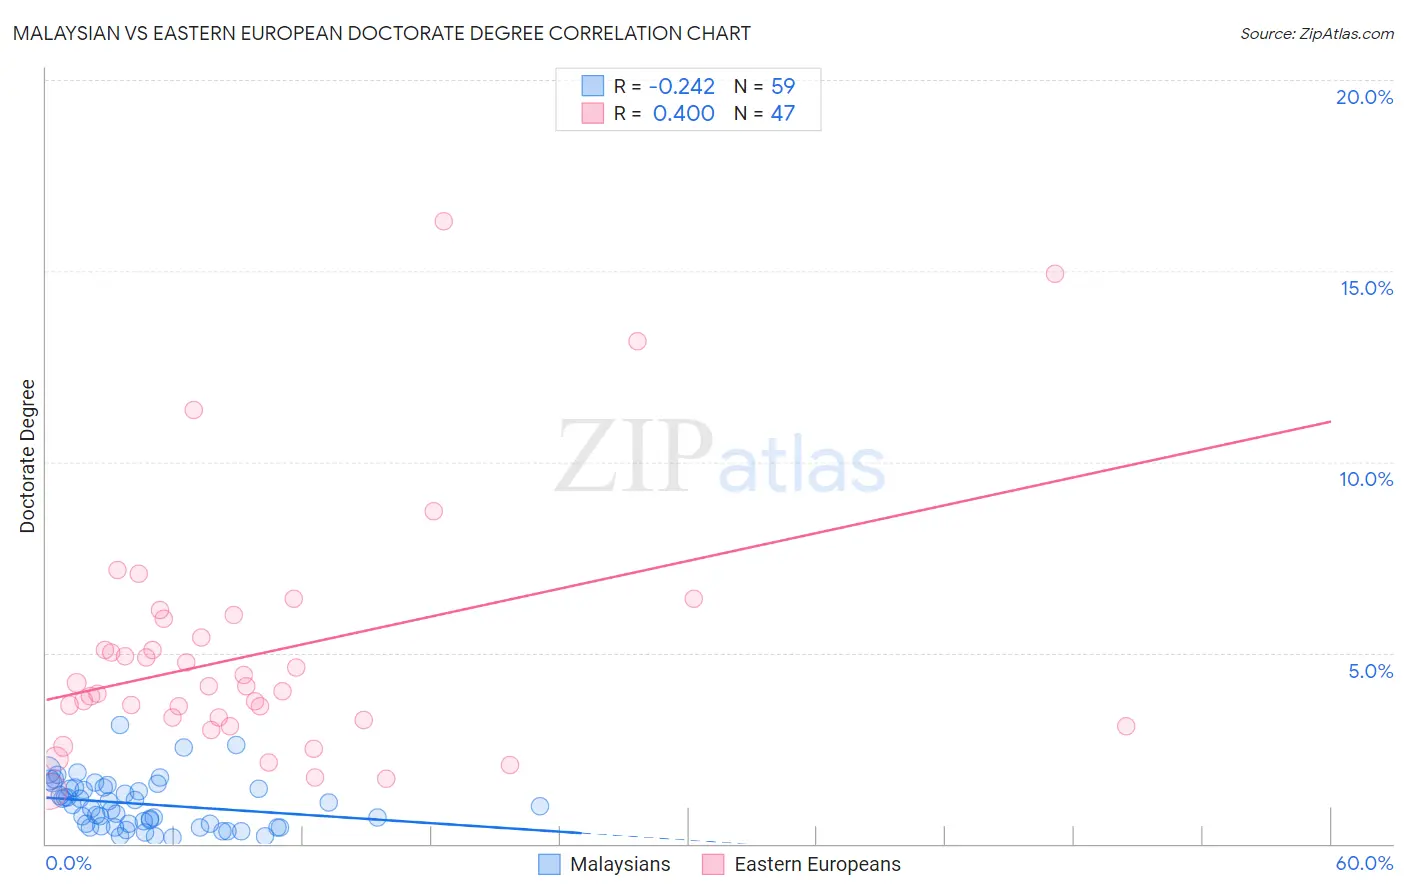
Malaysian vs Eastern European Doctorate Degree Correlation Chart
The statistical analysis conducted on geographies consisting of 224,756,978 people shows a weak negative correlation between the proportion of Malaysians and percentage of population with at least doctorate degree education in the United States with a correlation coefficient (R) of -0.242 and weighted average of 1.5%. Similarly, the statistical analysis conducted on geographies consisting of 454,559,491 people shows a moderate positive correlation between the proportion of Eastern Europeans and percentage of population with at least doctorate degree education in the United States with a correlation coefficient (R) of 0.400 and weighted average of 2.8%, a difference of 93.8%.
Doctorate Degree Correlation Summary
| Measurement | Malaysian | Eastern European |
| Minimum | 0.16% | 1.4% |
| Maximum | 3.1% | 16.3% |
| Range | 3.0% | 14.9% |
| Mean | 1.0% | 5.0% |
| Median | 1.00% | 4.1% |
| Interquartile 25% (IQ1) | 0.45% | 3.2% |
| Interquartile 75% (IQ3) | 1.5% | 5.9% |
| Interquartile Range (IQR) | 1.0% | 2.7% |
| Standard Deviation (Sample) | 0.65% | 3.2% |
| Standard Deviation (Population) | 0.64% | 3.2% |
Similar Demographics by Doctorate Degree
Demographics Similar to Malaysians by Doctorate Degree
In terms of doctorate degree, the demographic groups most similar to Malaysians are Jamaican (1.5%, a difference of 0.030%), Central American (1.5%, a difference of 0.070%), British West Indian (1.5%, a difference of 0.11%), Tohono O'odham (1.5%, a difference of 0.17%), and Cherokee (1.5%, a difference of 0.18%).
| Demographics | Rating | Rank | Doctorate Degree |
| Hawaiians | 0.4 /100 | #278 | Tragic 1.5% |
| Marshallese | 0.4 /100 | #279 | Tragic 1.5% |
| Ecuadorians | 0.4 /100 | #280 | Tragic 1.5% |
| Tohono O'odham | 0.4 /100 | #281 | Tragic 1.5% |
| British West Indians | 0.3 /100 | #282 | Tragic 1.5% |
| Central Americans | 0.3 /100 | #283 | Tragic 1.5% |
| Jamaicans | 0.3 /100 | #284 | Tragic 1.5% |
| Malaysians | 0.3 /100 | #285 | Tragic 1.5% |
| Cherokee | 0.3 /100 | #286 | Tragic 1.5% |
| Cajuns | 0.3 /100 | #287 | Tragic 1.5% |
| Immigrants | El Salvador | 0.3 /100 | #288 | Tragic 1.4% |
| Cape Verdeans | 0.3 /100 | #289 | Tragic 1.4% |
| Choctaw | 0.3 /100 | #290 | Tragic 1.4% |
| Blacks/African Americans | 0.3 /100 | #291 | Tragic 1.4% |
| Alaska Natives | 0.3 /100 | #292 | Tragic 1.4% |
Demographics Similar to Eastern Europeans by Doctorate Degree
In terms of doctorate degree, the demographic groups most similar to Eastern Europeans are Immigrants from India (2.8%, a difference of 0.32%), Immigrants from Australia (2.8%, a difference of 0.70%), Immigrants from Sri Lanka (2.8%, a difference of 0.94%), Immigrants from Japan (2.8%, a difference of 1.3%), and Immigrants from France (2.9%, a difference of 1.5%).
| Demographics | Rating | Rank | Doctorate Degree |
| Immigrants | Iran | 100.0 /100 | #9 | Exceptional 3.0% |
| Immigrants | Eastern Asia | 100.0 /100 | #10 | Exceptional 3.0% |
| Indians (Asian) | 100.0 /100 | #11 | Exceptional 2.9% |
| Immigrants | Belgium | 100.0 /100 | #12 | Exceptional 2.9% |
| Immigrants | Sweden | 100.0 /100 | #13 | Exceptional 2.9% |
| Immigrants | France | 100.0 /100 | #14 | Exceptional 2.9% |
| Immigrants | India | 100.0 /100 | #15 | Exceptional 2.8% |
| Eastern Europeans | 100.0 /100 | #16 | Exceptional 2.8% |
| Immigrants | Australia | 100.0 /100 | #17 | Exceptional 2.8% |
| Immigrants | Sri Lanka | 100.0 /100 | #18 | Exceptional 2.8% |
| Immigrants | Japan | 100.0 /100 | #19 | Exceptional 2.8% |
| Immigrants | Hong Kong | 100.0 /100 | #20 | Exceptional 2.8% |
| Thais | 100.0 /100 | #21 | Exceptional 2.8% |
| Mongolians | 100.0 /100 | #22 | Exceptional 2.8% |
| Immigrants | Denmark | 100.0 /100 | #23 | Exceptional 2.8% |