Malaysian vs Alaskan Athabascan Doctorate Degree
COMPARE
Malaysian
Alaskan Athabascan
Doctorate Degree
Doctorate Degree Comparison
Malaysians
Alaskan Athabascans
1.5%
DOCTORATE DEGREE
0.3/ 100
METRIC RATING
285th/ 347
METRIC RANK
1.7%
DOCTORATE DEGREE
13.8/ 100
METRIC RATING
215th/ 347
METRIC RANK
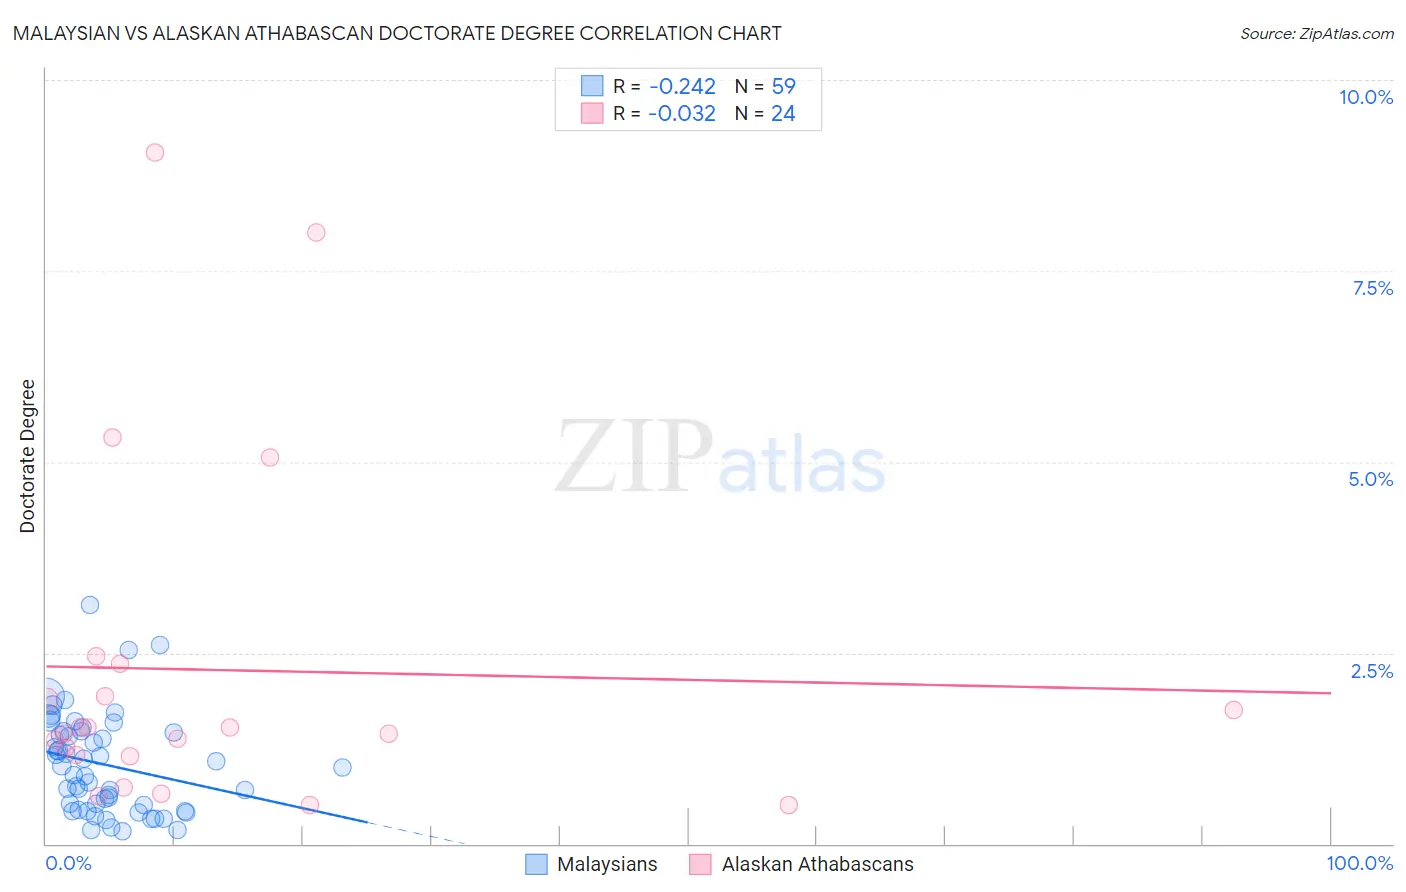
Malaysian vs Alaskan Athabascan Doctorate Degree Correlation Chart
The statistical analysis conducted on geographies consisting of 224,756,978 people shows a weak negative correlation between the proportion of Malaysians and percentage of population with at least doctorate degree education in the United States with a correlation coefficient (R) of -0.242 and weighted average of 1.5%. Similarly, the statistical analysis conducted on geographies consisting of 45,553,512 people shows no correlation between the proportion of Alaskan Athabascans and percentage of population with at least doctorate degree education in the United States with a correlation coefficient (R) of -0.032 and weighted average of 1.7%, a difference of 17.8%.
Doctorate Degree Correlation Summary
| Measurement | Malaysian | Alaskan Athabascan |
| Minimum | 0.16% | 0.51% |
| Maximum | 3.1% | 9.0% |
| Range | 3.0% | 8.5% |
| Mean | 1.0% | 2.3% |
| Median | 1.00% | 1.5% |
| Interquartile 25% (IQ1) | 0.45% | 1.2% |
| Interquartile 75% (IQ3) | 1.5% | 2.1% |
| Interquartile Range (IQR) | 1.0% | 0.98% |
| Standard Deviation (Sample) | 0.65% | 2.3% |
| Standard Deviation (Population) | 0.64% | 2.2% |
Similar Demographics by Doctorate Degree
Demographics Similar to Malaysians by Doctorate Degree
In terms of doctorate degree, the demographic groups most similar to Malaysians are Jamaican (1.5%, a difference of 0.030%), Central American (1.5%, a difference of 0.070%), British West Indian (1.5%, a difference of 0.11%), Tohono O'odham (1.5%, a difference of 0.17%), and Cherokee (1.5%, a difference of 0.18%).
| Demographics | Rating | Rank | Doctorate Degree |
| Hawaiians | 0.4 /100 | #278 | Tragic 1.5% |
| Marshallese | 0.4 /100 | #279 | Tragic 1.5% |
| Ecuadorians | 0.4 /100 | #280 | Tragic 1.5% |
| Tohono O'odham | 0.4 /100 | #281 | Tragic 1.5% |
| British West Indians | 0.3 /100 | #282 | Tragic 1.5% |
| Central Americans | 0.3 /100 | #283 | Tragic 1.5% |
| Jamaicans | 0.3 /100 | #284 | Tragic 1.5% |
| Malaysians | 0.3 /100 | #285 | Tragic 1.5% |
| Cherokee | 0.3 /100 | #286 | Tragic 1.5% |
| Cajuns | 0.3 /100 | #287 | Tragic 1.5% |
| Immigrants | El Salvador | 0.3 /100 | #288 | Tragic 1.4% |
| Cape Verdeans | 0.3 /100 | #289 | Tragic 1.4% |
| Choctaw | 0.3 /100 | #290 | Tragic 1.4% |
| Blacks/African Americans | 0.3 /100 | #291 | Tragic 1.4% |
| Alaska Natives | 0.3 /100 | #292 | Tragic 1.4% |
Demographics Similar to Alaskan Athabascans by Doctorate Degree
In terms of doctorate degree, the demographic groups most similar to Alaskan Athabascans are Immigrants from Burma/Myanmar (1.7%, a difference of 0.10%), Pueblo (1.7%, a difference of 0.14%), Korean (1.7%, a difference of 0.15%), Immigrants from South Eastern Asia (1.7%, a difference of 0.29%), and Spanish American (1.7%, a difference of 0.31%).
| Demographics | Rating | Rank | Doctorate Degree |
| Colombians | 16.1 /100 | #208 | Poor 1.7% |
| Immigrants | Western Africa | 15.4 /100 | #209 | Poor 1.7% |
| Tongans | 15.1 /100 | #210 | Poor 1.7% |
| Immigrants | Armenia | 15.1 /100 | #211 | Poor 1.7% |
| Immigrants | South Eastern Asia | 14.7 /100 | #212 | Poor 1.7% |
| Koreans | 14.2 /100 | #213 | Poor 1.7% |
| Pueblo | 14.2 /100 | #214 | Poor 1.7% |
| Alaskan Athabascans | 13.8 /100 | #215 | Poor 1.7% |
| Immigrants | Burma/Myanmar | 13.5 /100 | #216 | Poor 1.7% |
| Spanish Americans | 12.9 /100 | #217 | Poor 1.7% |
| Tlingit-Haida | 11.9 /100 | #218 | Poor 1.7% |
| Immigrants | Iraq | 10.7 /100 | #219 | Poor 1.7% |
| Immigrants | Uruguay | 9.2 /100 | #220 | Tragic 1.7% |
| Immigrants | Nonimmigrants | 8.8 /100 | #221 | Tragic 1.7% |
| Immigrants | Venezuela | 8.7 /100 | #222 | Tragic 1.7% |