Malaysian vs Immigrants from Egypt Doctorate Degree
COMPARE
Malaysian
Immigrants from Egypt
Doctorate Degree
Doctorate Degree Comparison
Malaysians
Immigrants from Egypt
1.5%
DOCTORATE DEGREE
0.3/ 100
METRIC RATING
285th/ 347
METRIC RANK
2.1%
DOCTORATE DEGREE
98.2/ 100
METRIC RATING
99th/ 347
METRIC RANK
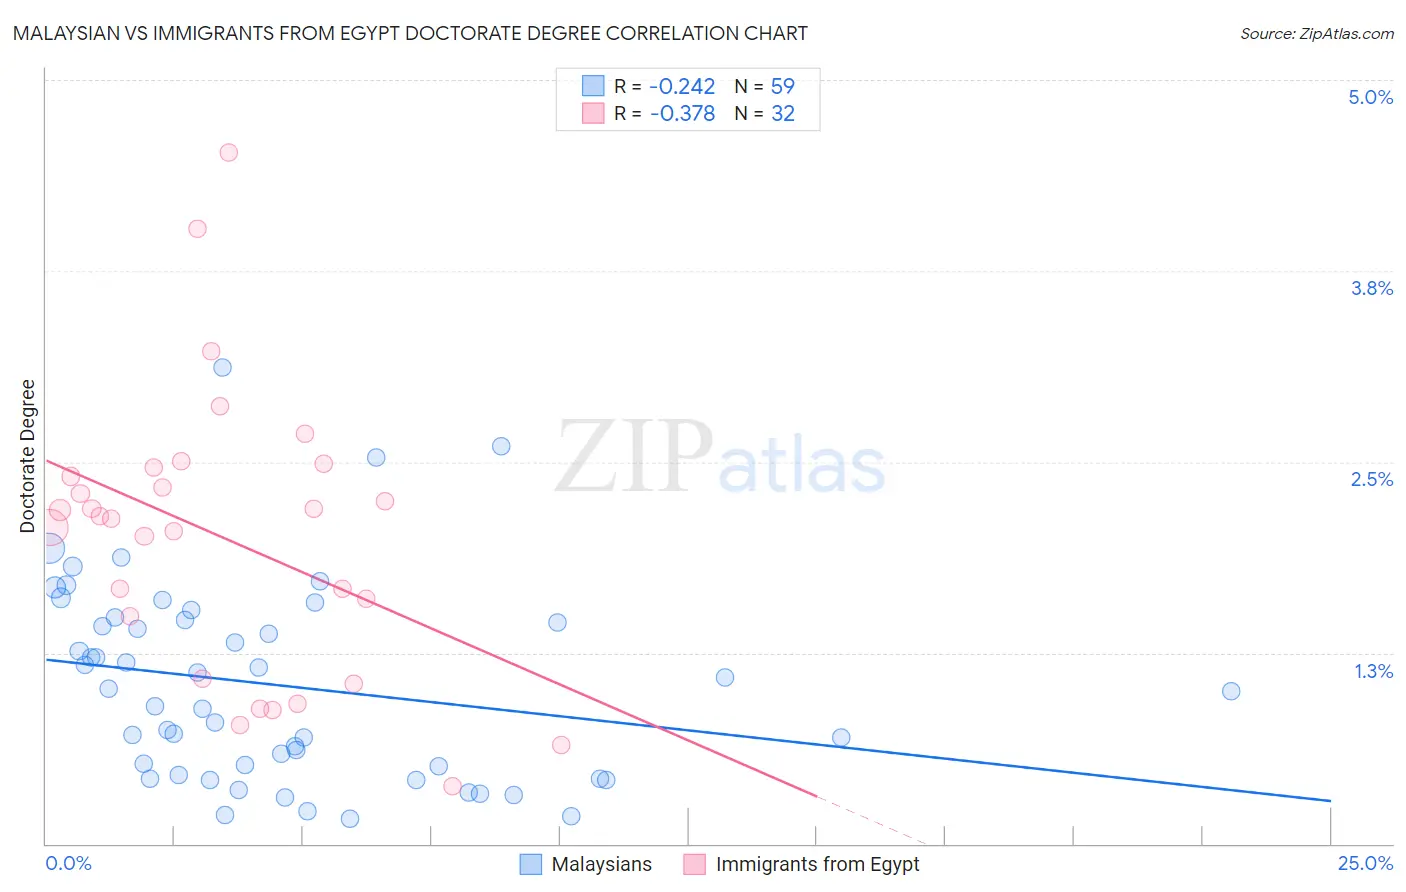
Malaysian vs Immigrants from Egypt Doctorate Degree Correlation Chart
The statistical analysis conducted on geographies consisting of 224,756,978 people shows a weak negative correlation between the proportion of Malaysians and percentage of population with at least doctorate degree education in the United States with a correlation coefficient (R) of -0.242 and weighted average of 1.5%. Similarly, the statistical analysis conducted on geographies consisting of 244,806,007 people shows a mild negative correlation between the proportion of Immigrants from Egypt and percentage of population with at least doctorate degree education in the United States with a correlation coefficient (R) of -0.378 and weighted average of 2.1%, a difference of 45.0%.
Doctorate Degree Correlation Summary
| Measurement | Malaysian | Immigrants from Egypt |
| Minimum | 0.16% | 0.38% |
| Maximum | 3.1% | 4.5% |
| Range | 3.0% | 4.1% |
| Mean | 1.0% | 2.0% |
| Median | 1.00% | 2.1% |
| Interquartile 25% (IQ1) | 0.45% | 1.3% |
| Interquartile 75% (IQ3) | 1.5% | 2.4% |
| Interquartile Range (IQR) | 1.0% | 1.1% |
| Standard Deviation (Sample) | 0.65% | 0.92% |
| Standard Deviation (Population) | 0.64% | 0.91% |
Similar Demographics by Doctorate Degree
Demographics Similar to Malaysians by Doctorate Degree
In terms of doctorate degree, the demographic groups most similar to Malaysians are Jamaican (1.5%, a difference of 0.030%), Central American (1.5%, a difference of 0.070%), British West Indian (1.5%, a difference of 0.11%), Tohono O'odham (1.5%, a difference of 0.17%), and Cherokee (1.5%, a difference of 0.18%).
| Demographics | Rating | Rank | Doctorate Degree |
| Hawaiians | 0.4 /100 | #278 | Tragic 1.5% |
| Marshallese | 0.4 /100 | #279 | Tragic 1.5% |
| Ecuadorians | 0.4 /100 | #280 | Tragic 1.5% |
| Tohono O'odham | 0.4 /100 | #281 | Tragic 1.5% |
| British West Indians | 0.3 /100 | #282 | Tragic 1.5% |
| Central Americans | 0.3 /100 | #283 | Tragic 1.5% |
| Jamaicans | 0.3 /100 | #284 | Tragic 1.5% |
| Malaysians | 0.3 /100 | #285 | Tragic 1.5% |
| Cherokee | 0.3 /100 | #286 | Tragic 1.5% |
| Cajuns | 0.3 /100 | #287 | Tragic 1.5% |
| Immigrants | El Salvador | 0.3 /100 | #288 | Tragic 1.4% |
| Cape Verdeans | 0.3 /100 | #289 | Tragic 1.4% |
| Choctaw | 0.3 /100 | #290 | Tragic 1.4% |
| Blacks/African Americans | 0.3 /100 | #291 | Tragic 1.4% |
| Alaska Natives | 0.3 /100 | #292 | Tragic 1.4% |
Demographics Similar to Immigrants from Egypt by Doctorate Degree
In terms of doctorate degree, the demographic groups most similar to Immigrants from Egypt are Immigrants from Eastern Europe (2.1%, a difference of 0.0%), Immigrants from Eastern Africa (2.1%, a difference of 0.030%), Armenian (2.1%, a difference of 0.18%), Immigrants from Chile (2.1%, a difference of 0.25%), and Immigrants from Eritrea (2.1%, a difference of 0.26%).
| Demographics | Rating | Rank | Doctorate Degree |
| Chileans | 99.1 /100 | #92 | Exceptional 2.2% |
| Alsatians | 99.0 /100 | #93 | Exceptional 2.1% |
| Greeks | 98.8 /100 | #94 | Exceptional 2.1% |
| Immigrants | Romania | 98.7 /100 | #95 | Exceptional 2.1% |
| Immigrants | Northern Africa | 98.4 /100 | #96 | Exceptional 2.1% |
| Immigrants | Eritrea | 98.4 /100 | #97 | Exceptional 2.1% |
| Armenians | 98.3 /100 | #98 | Exceptional 2.1% |
| Immigrants | Egypt | 98.2 /100 | #99 | Exceptional 2.1% |
| Immigrants | Eastern Europe | 98.2 /100 | #100 | Exceptional 2.1% |
| Immigrants | Eastern Africa | 98.2 /100 | #101 | Exceptional 2.1% |
| Immigrants | Chile | 98.1 /100 | #102 | Exceptional 2.1% |
| Romanians | 98.1 /100 | #103 | Exceptional 2.1% |
| Austrians | 98.0 /100 | #104 | Exceptional 2.1% |
| Arabs | 97.8 /100 | #105 | Exceptional 2.1% |
| Sudanese | 97.7 /100 | #106 | Exceptional 2.1% |