Italian vs Immigrants from Turkey Bachelor's Degree
COMPARE
Italian
Immigrants from Turkey
Bachelor's Degree
Bachelor's Degree Comparison
Italians
Immigrants from Turkey
40.1%
BACHELOR'S DEGREE
91.9/ 100
METRIC RATING
131st/ 347
METRIC RANK
46.0%
BACHELOR'S DEGREE
100.0/ 100
METRIC RATING
32nd/ 347
METRIC RANK
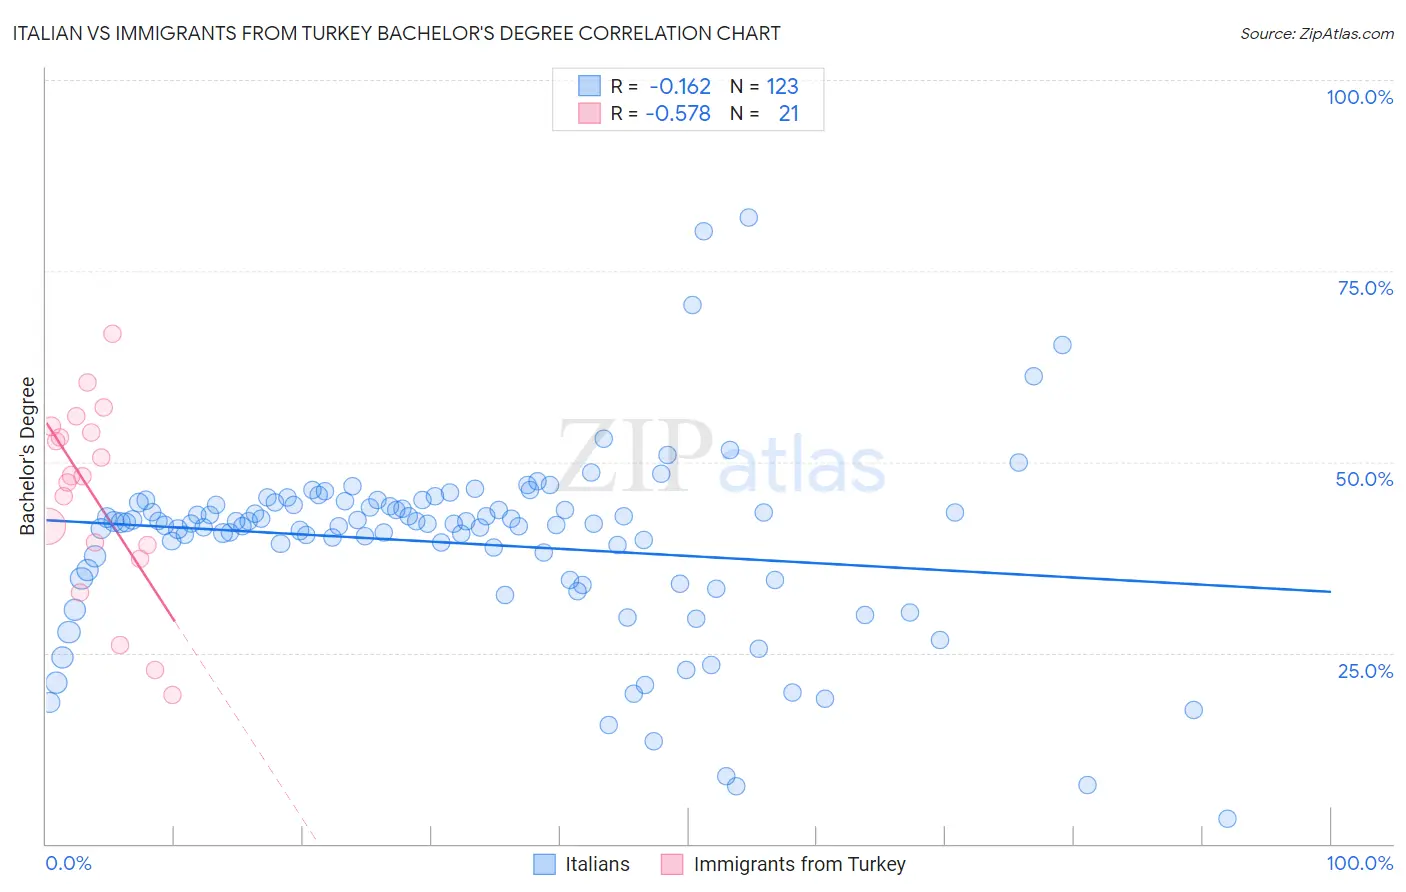
Italian vs Immigrants from Turkey Bachelor's Degree Correlation Chart
The statistical analysis conducted on geographies consisting of 574,930,631 people shows a poor negative correlation between the proportion of Italians and percentage of population with at least bachelor's degree education in the United States with a correlation coefficient (R) of -0.162 and weighted average of 40.1%. Similarly, the statistical analysis conducted on geographies consisting of 223,053,231 people shows a substantial negative correlation between the proportion of Immigrants from Turkey and percentage of population with at least bachelor's degree education in the United States with a correlation coefficient (R) of -0.578 and weighted average of 46.0%, a difference of 14.7%.
Bachelor's Degree Correlation Summary
| Measurement | Italian | Immigrants from Turkey |
| Minimum | 3.2% | 19.5% |
| Maximum | 82.0% | 66.8% |
| Range | 78.7% | 47.3% |
| Mean | 39.3% | 45.4% |
| Median | 42.0% | 48.1% |
| Interquartile 25% (IQ1) | 34.5% | 38.2% |
| Interquartile 75% (IQ3) | 44.3% | 54.2% |
| Interquartile Range (IQR) | 9.8% | 16.0% |
| Standard Deviation (Sample) | 12.1% | 12.5% |
| Standard Deviation (Population) | 12.1% | 12.2% |
Similar Demographics by Bachelor's Degree
Demographics Similar to Italians by Bachelor's Degree
In terms of bachelor's degree, the demographic groups most similar to Italians are Sierra Leonean (40.1%, a difference of 0.080%), Serbian (40.1%, a difference of 0.15%), Taiwanese (40.0%, a difference of 0.25%), Immigrants from Southern Europe (40.0%, a difference of 0.25%), and Immigrants from Venezuela (40.2%, a difference of 0.32%).
| Demographics | Rating | Rank | Bachelor's Degree |
| Immigrants | Eritrea | 94.3 /100 | #124 | Exceptional 40.4% |
| British | 94.2 /100 | #125 | Exceptional 40.4% |
| Immigrants | Eastern Africa | 94.1 /100 | #126 | Exceptional 40.4% |
| Immigrants | Jordan | 93.4 /100 | #127 | Exceptional 40.3% |
| Immigrants | Venezuela | 92.9 /100 | #128 | Exceptional 40.2% |
| Serbians | 92.4 /100 | #129 | Exceptional 40.1% |
| Sierra Leoneans | 92.2 /100 | #130 | Exceptional 40.1% |
| Italians | 91.9 /100 | #131 | Exceptional 40.1% |
| Taiwanese | 91.1 /100 | #132 | Exceptional 40.0% |
| Immigrants | Southern Europe | 91.1 /100 | #133 | Exceptional 40.0% |
| Assyrians/Chaldeans/Syriacs | 89.4 /100 | #134 | Excellent 39.8% |
| Luxembourgers | 89.1 /100 | #135 | Excellent 39.8% |
| Pakistanis | 88.2 /100 | #136 | Excellent 39.7% |
| Icelanders | 86.5 /100 | #137 | Excellent 39.5% |
| Europeans | 85.6 /100 | #138 | Excellent 39.5% |
Demographics Similar to Immigrants from Turkey by Bachelor's Degree
In terms of bachelor's degree, the demographic groups most similar to Immigrants from Turkey are Latvian (46.1%, a difference of 0.30%), Immigrants from Sri Lanka (46.1%, a difference of 0.34%), Israeli (46.1%, a difference of 0.39%), Turkish (46.2%, a difference of 0.52%), and Immigrants from Northern Europe (45.6%, a difference of 0.70%).
| Demographics | Rating | Rank | Bachelor's Degree |
| Burmese | 100.0 /100 | #25 | Exceptional 46.9% |
| Immigrants | Japan | 100.0 /100 | #26 | Exceptional 46.8% |
| Immigrants | France | 100.0 /100 | #27 | Exceptional 46.4% |
| Turks | 100.0 /100 | #28 | Exceptional 46.2% |
| Israelis | 100.0 /100 | #29 | Exceptional 46.1% |
| Immigrants | Sri Lanka | 100.0 /100 | #30 | Exceptional 46.1% |
| Latvians | 100.0 /100 | #31 | Exceptional 46.1% |
| Immigrants | Turkey | 100.0 /100 | #32 | Exceptional 46.0% |
| Immigrants | Northern Europe | 100.0 /100 | #33 | Exceptional 45.6% |
| Immigrants | Denmark | 100.0 /100 | #34 | Exceptional 45.4% |
| Immigrants | Russia | 100.0 /100 | #35 | Exceptional 45.4% |
| Mongolians | 100.0 /100 | #36 | Exceptional 45.4% |
| Russians | 100.0 /100 | #37 | Exceptional 45.3% |
| Bulgarians | 100.0 /100 | #38 | Exceptional 45.3% |
| Immigrants | Latvia | 100.0 /100 | #39 | Exceptional 45.1% |