Immigrants from Ghana vs Immigrants from Turkey Bachelor's Degree
COMPARE
Immigrants from Ghana
Immigrants from Turkey
Bachelor's Degree
Bachelor's Degree Comparison
Immigrants from Ghana
Immigrants from Turkey
36.9%
BACHELOR'S DEGREE
27.4/ 100
METRIC RATING
200th/ 347
METRIC RANK
46.0%
BACHELOR'S DEGREE
100.0/ 100
METRIC RATING
32nd/ 347
METRIC RANK
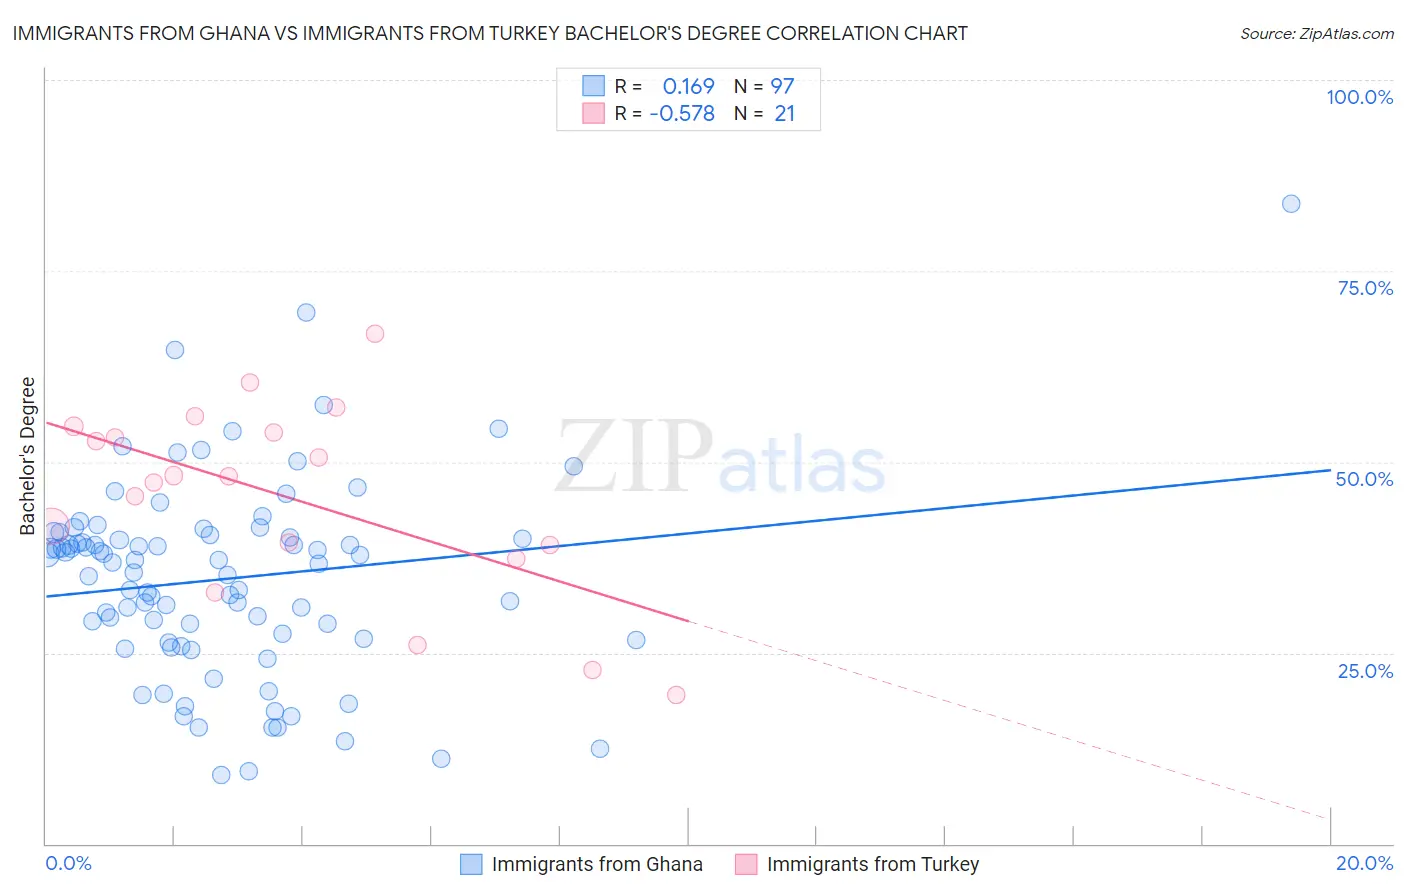
Immigrants from Ghana vs Immigrants from Turkey Bachelor's Degree Correlation Chart
The statistical analysis conducted on geographies consisting of 199,935,745 people shows a poor positive correlation between the proportion of Immigrants from Ghana and percentage of population with at least bachelor's degree education in the United States with a correlation coefficient (R) of 0.169 and weighted average of 36.9%. Similarly, the statistical analysis conducted on geographies consisting of 223,053,231 people shows a substantial negative correlation between the proportion of Immigrants from Turkey and percentage of population with at least bachelor's degree education in the United States with a correlation coefficient (R) of -0.578 and weighted average of 46.0%, a difference of 24.4%.
Bachelor's Degree Correlation Summary
| Measurement | Immigrants from Ghana | Immigrants from Turkey |
| Minimum | 9.1% | 19.5% |
| Maximum | 83.8% | 66.8% |
| Range | 74.7% | 47.3% |
| Mean | 34.7% | 45.4% |
| Median | 36.8% | 48.1% |
| Interquartile 25% (IQ1) | 26.7% | 38.2% |
| Interquartile 75% (IQ3) | 40.3% | 54.2% |
| Interquartile Range (IQR) | 13.5% | 16.0% |
| Standard Deviation (Sample) | 12.8% | 12.5% |
| Standard Deviation (Population) | 12.7% | 12.2% |
Similar Demographics by Bachelor's Degree
Demographics Similar to Immigrants from Ghana by Bachelor's Degree
In terms of bachelor's degree, the demographic groups most similar to Immigrants from Ghana are Immigrants from Costa Rica (36.9%, a difference of 0.0%), Welsh (37.0%, a difference of 0.21%), Czechoslovakian (37.0%, a difference of 0.22%), Immigrants from South Eastern Asia (36.8%, a difference of 0.26%), and Celtic (37.0%, a difference of 0.27%).
| Demographics | Rating | Rank | Bachelor's Degree |
| Yugoslavians | 31.5 /100 | #193 | Fair 37.1% |
| Belgians | 29.9 /100 | #194 | Fair 37.0% |
| Koreans | 29.8 /100 | #195 | Fair 37.0% |
| Celtics | 29.5 /100 | #196 | Fair 37.0% |
| Czechoslovakians | 29.2 /100 | #197 | Fair 37.0% |
| Welsh | 29.1 /100 | #198 | Fair 37.0% |
| Immigrants | Costa Rica | 27.4 /100 | #199 | Fair 36.9% |
| Immigrants | Ghana | 27.4 /100 | #200 | Fair 36.9% |
| Immigrants | South Eastern Asia | 25.4 /100 | #201 | Fair 36.8% |
| Immigrants | Zaire | 25.3 /100 | #202 | Fair 36.8% |
| Immigrants | Nigeria | 23.1 /100 | #203 | Fair 36.7% |
| Immigrants | Immigrants | 22.8 /100 | #204 | Fair 36.7% |
| Finns | 22.2 /100 | #205 | Fair 36.7% |
| Spaniards | 21.2 /100 | #206 | Fair 36.6% |
| Immigrants | Middle Africa | 20.6 /100 | #207 | Fair 36.6% |
Demographics Similar to Immigrants from Turkey by Bachelor's Degree
In terms of bachelor's degree, the demographic groups most similar to Immigrants from Turkey are Latvian (46.1%, a difference of 0.30%), Immigrants from Sri Lanka (46.1%, a difference of 0.34%), Israeli (46.1%, a difference of 0.39%), Turkish (46.2%, a difference of 0.52%), and Immigrants from Northern Europe (45.6%, a difference of 0.70%).
| Demographics | Rating | Rank | Bachelor's Degree |
| Burmese | 100.0 /100 | #25 | Exceptional 46.9% |
| Immigrants | Japan | 100.0 /100 | #26 | Exceptional 46.8% |
| Immigrants | France | 100.0 /100 | #27 | Exceptional 46.4% |
| Turks | 100.0 /100 | #28 | Exceptional 46.2% |
| Israelis | 100.0 /100 | #29 | Exceptional 46.1% |
| Immigrants | Sri Lanka | 100.0 /100 | #30 | Exceptional 46.1% |
| Latvians | 100.0 /100 | #31 | Exceptional 46.1% |
| Immigrants | Turkey | 100.0 /100 | #32 | Exceptional 46.0% |
| Immigrants | Northern Europe | 100.0 /100 | #33 | Exceptional 45.6% |
| Immigrants | Denmark | 100.0 /100 | #34 | Exceptional 45.4% |
| Immigrants | Russia | 100.0 /100 | #35 | Exceptional 45.4% |
| Mongolians | 100.0 /100 | #36 | Exceptional 45.4% |
| Russians | 100.0 /100 | #37 | Exceptional 45.3% |
| Bulgarians | 100.0 /100 | #38 | Exceptional 45.3% |
| Immigrants | Latvia | 100.0 /100 | #39 | Exceptional 45.1% |