Ecuadorian vs Immigrants from Spain 8th Grade
COMPARE
Ecuadorian
Immigrants from Spain
8th Grade
8th Grade Comparison
Ecuadorians
Immigrants from Spain
93.6%
8TH GRADE
0.0/ 100
METRIC RATING
308th/ 347
METRIC RANK
95.7%
8TH GRADE
38.7/ 100
METRIC RATING
181st/ 347
METRIC RANK
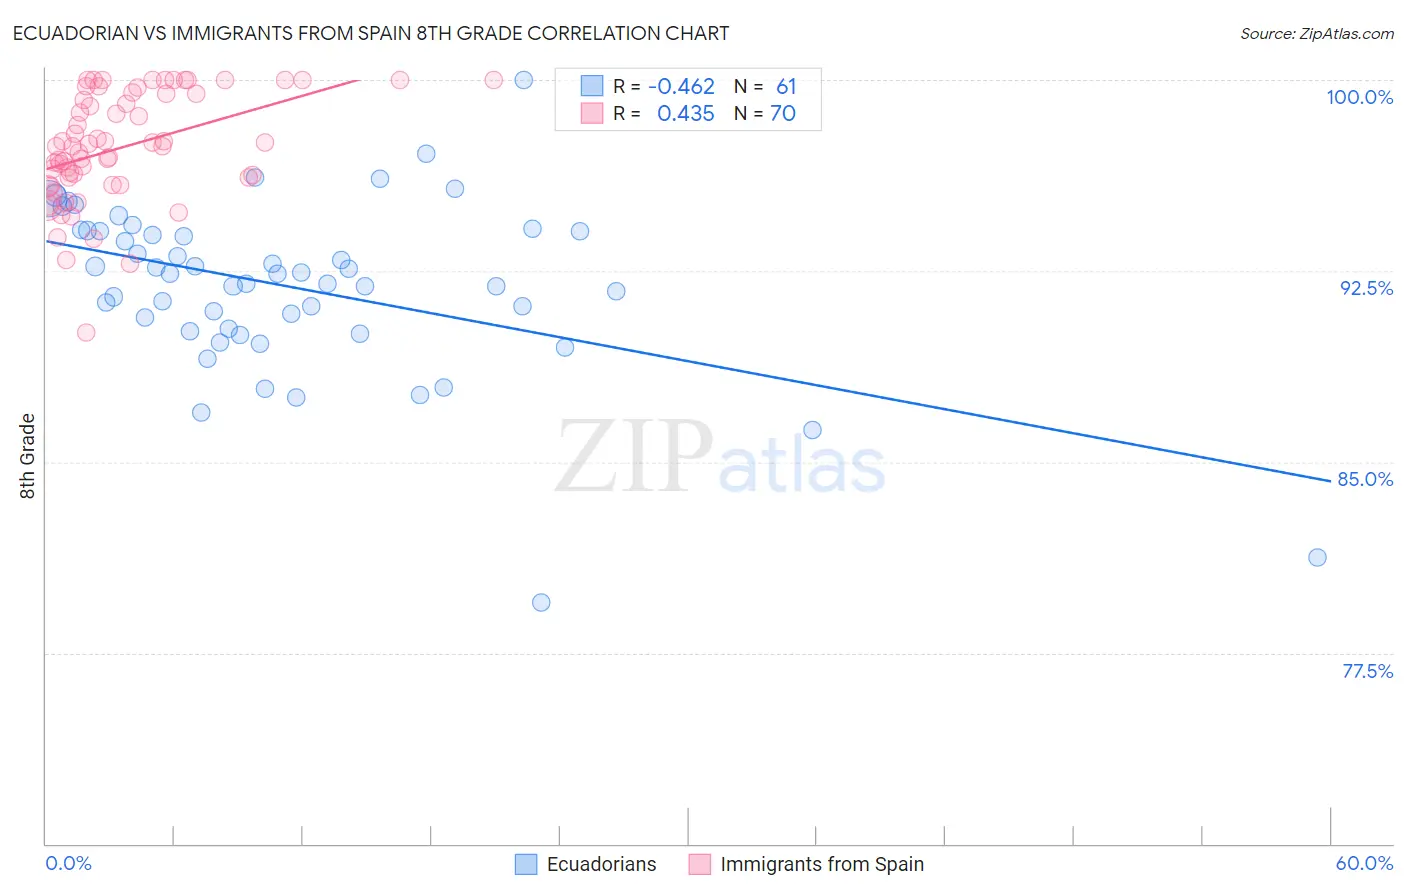
Ecuadorian vs Immigrants from Spain 8th Grade Correlation Chart
The statistical analysis conducted on geographies consisting of 317,753,005 people shows a moderate negative correlation between the proportion of Ecuadorians and percentage of population with at least 8th grade education in the United States with a correlation coefficient (R) of -0.462 and weighted average of 93.6%. Similarly, the statistical analysis conducted on geographies consisting of 239,679,100 people shows a moderate positive correlation between the proportion of Immigrants from Spain and percentage of population with at least 8th grade education in the United States with a correlation coefficient (R) of 0.435 and weighted average of 95.7%, a difference of 2.2%.
8th Grade Correlation Summary
| Measurement | Ecuadorian | Immigrants from Spain |
| Minimum | 79.5% | 90.1% |
| Maximum | 100.0% | 100.0% |
| Range | 20.5% | 9.9% |
| Mean | 91.9% | 97.4% |
| Median | 92.4% | 97.4% |
| Interquartile 25% (IQ1) | 90.2% | 96.1% |
| Interquartile 75% (IQ3) | 94.1% | 99.5% |
| Interquartile Range (IQR) | 3.9% | 3.3% |
| Standard Deviation (Sample) | 3.4% | 2.1% |
| Standard Deviation (Population) | 3.4% | 2.1% |
Similar Demographics by 8th Grade
Demographics Similar to Ecuadorians by 8th Grade
In terms of 8th grade, the demographic groups most similar to Ecuadorians are Immigrants (93.6%, a difference of 0.020%), Japanese (93.6%, a difference of 0.030%), Immigrants from Bangladesh (93.6%, a difference of 0.030%), Cape Verdean (93.5%, a difference of 0.070%), and Immigrants from Caribbean (93.5%, a difference of 0.10%).
| Demographics | Rating | Rank | 8th Grade |
| Immigrants | Laos | 0.0 /100 | #301 | Tragic 94.1% |
| Sri Lankans | 0.0 /100 | #302 | Tragic 94.0% |
| Immigrants | Dominica | 0.0 /100 | #303 | Tragic 94.0% |
| Guyanese | 0.0 /100 | #304 | Tragic 93.9% |
| Immigrants | Haiti | 0.0 /100 | #305 | Tragic 93.9% |
| Immigrants | Guyana | 0.0 /100 | #306 | Tragic 93.8% |
| Immigrants | Portugal | 0.0 /100 | #307 | Tragic 93.8% |
| Ecuadorians | 0.0 /100 | #308 | Tragic 93.6% |
| Immigrants | Immigrants | 0.0 /100 | #309 | Tragic 93.6% |
| Japanese | 0.0 /100 | #310 | Tragic 93.6% |
| Immigrants | Bangladesh | 0.0 /100 | #311 | Tragic 93.6% |
| Cape Verdeans | 0.0 /100 | #312 | Tragic 93.5% |
| Immigrants | Caribbean | 0.0 /100 | #313 | Tragic 93.5% |
| Immigrants | Vietnam | 0.0 /100 | #314 | Tragic 93.5% |
| Vietnamese | 0.0 /100 | #315 | Tragic 93.5% |
Demographics Similar to Immigrants from Spain by 8th Grade
In terms of 8th grade, the demographic groups most similar to Immigrants from Spain are Iraqi (95.7%, a difference of 0.010%), Immigrants from Egypt (95.7%, a difference of 0.010%), Immigrants from Iraq (95.6%, a difference of 0.020%), Immigrants from Uganda (95.6%, a difference of 0.020%), and Black/African American (95.6%, a difference of 0.030%).
| Demographics | Rating | Rank | 8th Grade |
| Chileans | 50.0 /100 | #174 | Average 95.7% |
| Immigrants | Albania | 49.6 /100 | #175 | Average 95.7% |
| Pakistanis | 48.8 /100 | #176 | Average 95.7% |
| Marshallese | 47.6 /100 | #177 | Average 95.7% |
| Venezuelans | 47.5 /100 | #178 | Average 95.7% |
| Immigrants | Brazil | 45.4 /100 | #179 | Average 95.7% |
| Iraqis | 40.5 /100 | #180 | Average 95.7% |
| Immigrants | Spain | 38.7 /100 | #181 | Fair 95.7% |
| Immigrants | Egypt | 37.9 /100 | #182 | Fair 95.7% |
| Immigrants | Iraq | 36.2 /100 | #183 | Fair 95.6% |
| Immigrants | Uganda | 36.0 /100 | #184 | Fair 95.6% |
| Blacks/African Americans | 34.8 /100 | #185 | Fair 95.6% |
| Brazilians | 34.8 /100 | #186 | Fair 95.6% |
| Sudanese | 33.0 /100 | #187 | Fair 95.6% |
| Liberians | 32.4 /100 | #188 | Fair 95.6% |