Macedonian vs Immigrants from Spain Female Disability
COMPARE
Macedonian
Immigrants from Spain
Female Disability
Female Disability Comparison
Macedonians
Immigrants from Spain
11.8%
FEMALE DISABILITY
95.5/ 100
METRIC RATING
129th/ 347
METRIC RANK
11.4%
FEMALE DISABILITY
99.9/ 100
METRIC RATING
59th/ 347
METRIC RANK
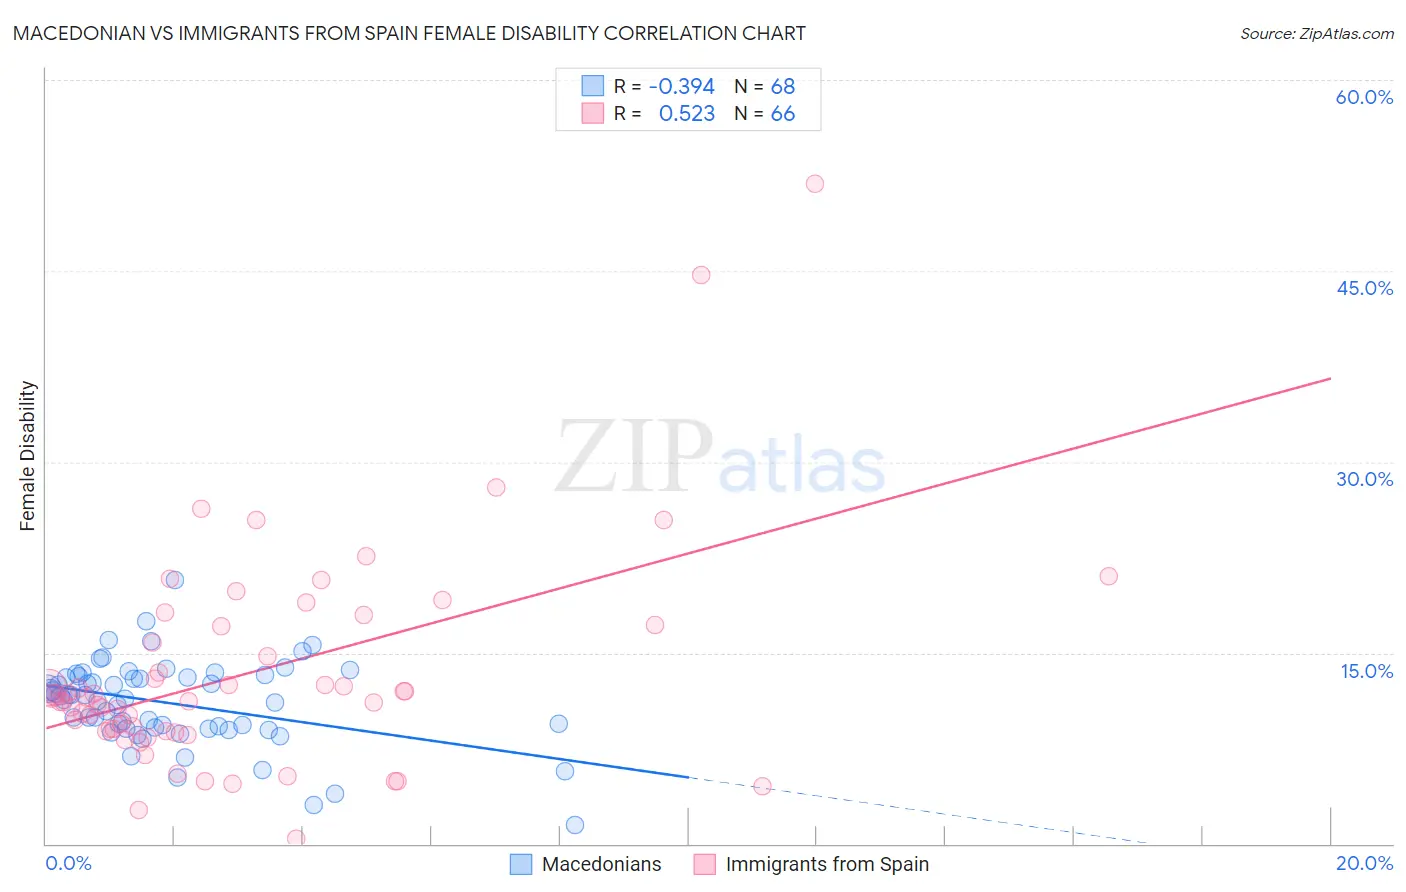
Macedonian vs Immigrants from Spain Female Disability Correlation Chart
The statistical analysis conducted on geographies consisting of 132,656,541 people shows a mild negative correlation between the proportion of Macedonians and percentage of females with a disability in the United States with a correlation coefficient (R) of -0.394 and weighted average of 11.8%. Similarly, the statistical analysis conducted on geographies consisting of 239,683,022 people shows a substantial positive correlation between the proportion of Immigrants from Spain and percentage of females with a disability in the United States with a correlation coefficient (R) of 0.523 and weighted average of 11.4%, a difference of 4.0%.
Female Disability Correlation Summary
| Measurement | Macedonian | Immigrants from Spain |
| Minimum | 1.4% | 0.40% |
| Maximum | 20.8% | 51.8% |
| Range | 19.3% | 51.4% |
| Mean | 11.0% | 13.4% |
| Median | 11.5% | 11.4% |
| Interquartile 25% (IQ1) | 9.1% | 8.8% |
| Interquartile 75% (IQ3) | 13.1% | 17.1% |
| Interquartile Range (IQR) | 4.0% | 8.2% |
| Standard Deviation (Sample) | 3.3% | 8.5% |
| Standard Deviation (Population) | 3.3% | 8.5% |
Similar Demographics by Female Disability
Demographics Similar to Macedonians by Female Disability
In terms of female disability, the demographic groups most similar to Macedonians are Immigrants from Latvia (11.8%, a difference of 0.030%), Nicaraguan (11.9%, a difference of 0.060%), South American Indian (11.8%, a difference of 0.070%), Arab (11.9%, a difference of 0.090%), and Immigrants from Europe (11.8%, a difference of 0.17%).
| Demographics | Rating | Rank | Female Disability |
| Immigrants | North Macedonia | 96.8 /100 | #122 | Exceptional 11.8% |
| Immigrants | Croatia | 96.7 /100 | #123 | Exceptional 11.8% |
| Russians | 96.5 /100 | #124 | Exceptional 11.8% |
| Immigrants | Italy | 96.4 /100 | #125 | Exceptional 11.8% |
| Immigrants | Europe | 96.2 /100 | #126 | Exceptional 11.8% |
| South American Indians | 95.8 /100 | #127 | Exceptional 11.8% |
| Immigrants | Latvia | 95.6 /100 | #128 | Exceptional 11.8% |
| Macedonians | 95.5 /100 | #129 | Exceptional 11.8% |
| Nicaraguans | 95.2 /100 | #130 | Exceptional 11.9% |
| Arabs | 95.1 /100 | #131 | Exceptional 11.9% |
| Immigrants | Syria | 94.6 /100 | #132 | Exceptional 11.9% |
| Kenyans | 94.5 /100 | #133 | Exceptional 11.9% |
| Immigrants | Nicaragua | 94.5 /100 | #134 | Exceptional 11.9% |
| Central Americans | 94.2 /100 | #135 | Exceptional 11.9% |
| Ugandans | 94.0 /100 | #136 | Exceptional 11.9% |
Demographics Similar to Immigrants from Spain by Female Disability
In terms of female disability, the demographic groups most similar to Immigrants from Spain are Immigrants from Bulgaria (11.4%, a difference of 0.11%), Laotian (11.4%, a difference of 0.13%), South American (11.4%, a difference of 0.15%), Immigrants from France (11.4%, a difference of 0.17%), and Taiwanese (11.4%, a difference of 0.23%).
| Demographics | Rating | Rank | Female Disability |
| Immigrants | Peru | 99.9 /100 | #52 | Exceptional 11.3% |
| Immigrants | Saudi Arabia | 99.9 /100 | #53 | Exceptional 11.3% |
| Peruvians | 99.9 /100 | #54 | Exceptional 11.3% |
| Bulgarians | 99.9 /100 | #55 | Exceptional 11.3% |
| Taiwanese | 99.9 /100 | #56 | Exceptional 11.4% |
| South Americans | 99.9 /100 | #57 | Exceptional 11.4% |
| Laotians | 99.9 /100 | #58 | Exceptional 11.4% |
| Immigrants | Spain | 99.9 /100 | #59 | Exceptional 11.4% |
| Immigrants | Bulgaria | 99.9 /100 | #60 | Exceptional 11.4% |
| Immigrants | France | 99.9 /100 | #61 | Exceptional 11.4% |
| Sri Lankans | 99.9 /100 | #62 | Exceptional 11.4% |
| Immigrants | Colombia | 99.9 /100 | #63 | Exceptional 11.4% |
| Immigrants | El Salvador | 99.9 /100 | #64 | Exceptional 11.4% |
| Immigrants | South America | 99.9 /100 | #65 | Exceptional 11.4% |
| Salvadorans | 99.8 /100 | #66 | Exceptional 11.5% |